
EURGBP Elliott Wave Analysis - Trading Lounge
Euro/British Pound (EURGBP) Day Chart
EURGBP Elliott Wave Technical Analysis
FUNCTION: Counter Trend
MODE: Corrective
STRUCTURE: Orange Wave 2
POSITION: Navy Blue Wave 3
DIRECTION NEXT HIGHER DEGREES: Orange Wave 3
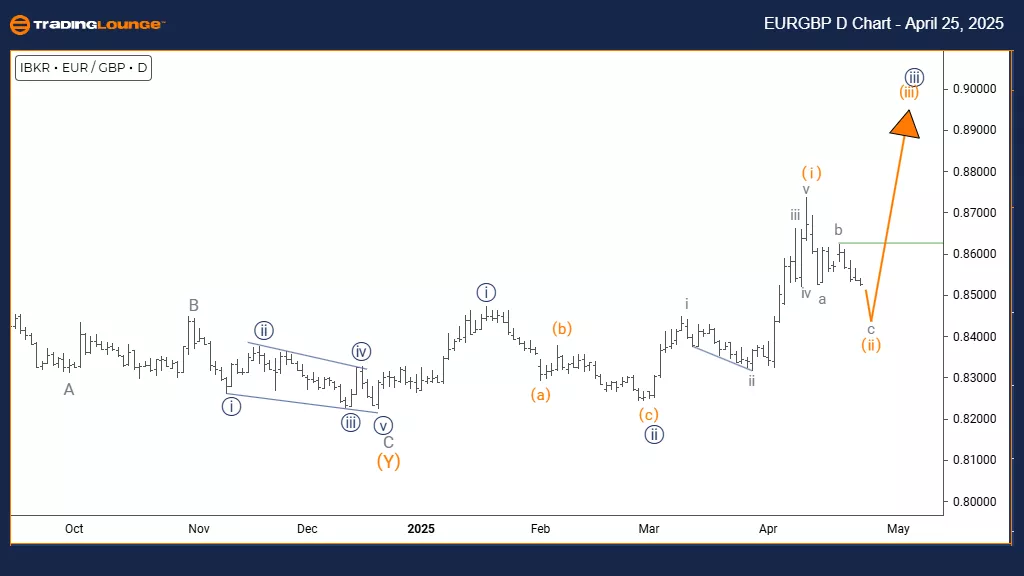
DETAILS: Orange wave 1 appears completed, with wave 2 now unfolding.
The EURGBP daily chart currently shows a corrective movement against the dominant bearish trend. After the completion of the orange wave 1 decline, the pair has entered orange wave 2—a corrective phase within the broader navy blue wave 3 downtrend. This setup signals a temporary upward retracement before the likely continuation of the main bearish movement.
Orange wave 2 is expected to retrace between 38% and 61% of the decline seen in wave 1. This correction phase often features overlapping price moves and weaker momentum, which are common signs of corrective patterns. The daily chart context indicates this could be a short-term pause in a longer bearish structure.
Following the conclusion of wave 2, a strong downward move—orange wave 3—is anticipated. This next impulse could extend beyond the previous low of wave 1. Traders should watch for signs of wave 2 ending, such as bearish reversal signals and overbought momentum indicators.
This corrective wave offers a potential entry for traders preparing for wave 3's expected drop. Analytical tools can aid in confirming the end of this correction and the start of the next bearish leg. The chart structure supports the view that the EURGBP pair may soon continue downward after this current phase.
Close tracking of price action near Fibonacci retracement zones will be crucial for determining optimal entry points. The daily timeframe reinforces the importance of this correction within the wider bearish outlook.
Euro/British Pound (EURGBP) 4-Hour Chart
EURGBP Elliott Wave Technical Analysis
FUNCTION: Counter Trend
MODE: Impulsive as C
STRUCTURE: Gray Wave C
POSITION: Orange Wave 2
DIRECTION NEXT HIGHER DEGREES: Orange Wave 3
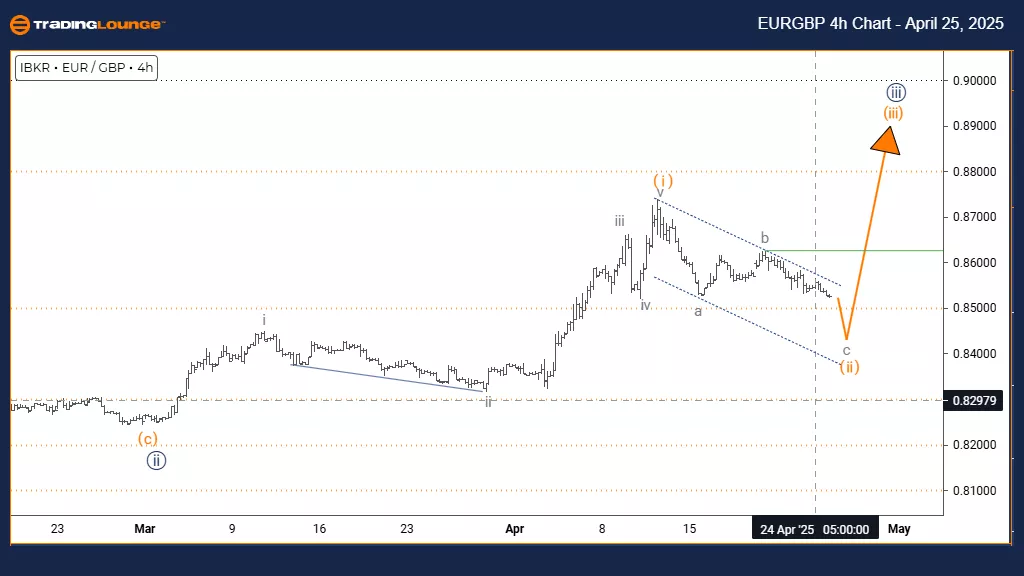
DETAILS: Gray wave B of wave 2 seems complete, with gray wave C now unfolding.
The EURGBP 4-hour chart shows a counter-trend pattern developing through an impulsive wave sequence. Following the completion of gray wave B, the pair has moved into gray wave C within the larger corrective structure of orange wave 2. This phase suggests a temporary upward price movement within a broader retracement setup.
Gray wave C often acts as the final push in a corrective sequence and typically carries strong momentum. With wave B concluded, gray wave C is progressing upward, likely extending higher before the correction finishes. The chart points to a continuation of this move before the expected trend shift.
The next major move is projected to be orange wave 3, a downward impulse, resuming the overall trend direction. This wave is anticipated to push prices lower and complete the corrective cycle. The 4-hour view offers vital context, highlighting this as a short-lived counter-trend move within a broader market trend.
Traders should observe wave C's characteristics, looking for signs such as consistent upward momentum and typical impulsive behavior. The structure indicates that a larger trend continuation could follow this correction. Technical indicators will be useful in confirming the wave transition.
This setup gives traders an opportunity to prepare for a possible bearish trend continuation once wave C completes. Monitoring price behavior and structural patterns will be key to identifying the end of the correction and the start of the next trend wave.
Technical Analyst: Malik Awais
More By This Author:
Elliott Wave Technical Analysis: Ethereum Crypto Price News For Friday, April 25
Elliott Wave Technical Forecast : Amcor Plc
Elliott Wave Technical Analysis: The Boeing Company - Thursday, April 24


Comments
Log in or sign up to join the conversation.