

Image Source: Unsplash
AUDUSD Elliott Wave Analysis Trading Lounge Day Chart, 29 August 2023
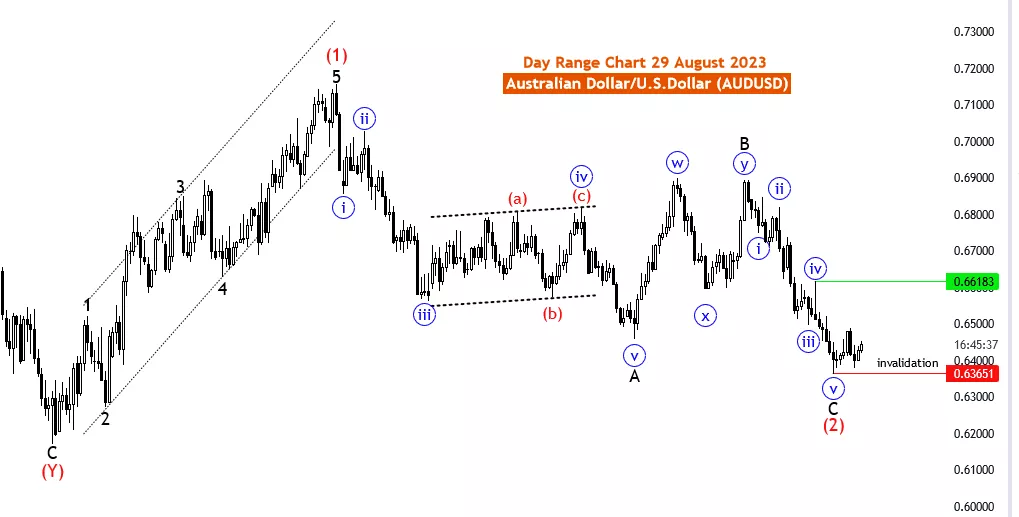
Australian Dollar/U.S.Dollar (AUDUSD) Day Chart
AUDUSDElliott Wave Technical Analysis
Function: Trend
Mode: impulsive
Structure: new impulsive
Position: Red wave 3
Direction Next Higher Degrees: After blue wave 5 of C of 2 new uptrend looking Started Details: Red Wave “2” looking completed at 0.63649, new impulsive for uptrend started, looking for first bullish confirmation at 0.66183. Wave Cancel invalid level: 0.63651
The AUDUSD Elliott Wave Analysis for 29 August 23, focuses on the day chart of the Australian Dollar/U.S. Dollar currency pair, providing insights into impulsive trend trading strategies within a newly emerging uptrend.
The core emphasis of this analysis lies in identifying the Function as a Trend, suggesting that the prevailing market conditions are conducive to a sustained and directional price movement. This insight is crucial for traders as they seek to capitalize on the ongoing market momentum.
The Mode is identified as impulsive, indicating that the anticipated price movement is likely to exhibit strong and decisive momentum. This resonates with the concept of impulsive trading strategies, where traders aim to capture substantial price moves within a relatively short time frame.
The Structure is defined as a new impulsive, implying the emergence of a fresh impulse wave. This information is pivotal for traders as it enables them to gauge the strength and potential duration of the upcoming price movement, aiding in effective trade management.
The Position is highlighted as Red wave 3, offering a glimpse into the current wave count and position within the broader wave structure. This knowledge is fundamental for traders to comprehend the broader context of the market and identify potential inflection points.
Furthermore, the Direction Next Higher Degrees is specified as After blue wave 5 of C of 2 new uptrend looking Started. This signifies the initiation of a new uptrend after a corrective phase. Understanding the directional shift is imperative for traders to adapt their trading strategies accordingly.
A notable insight provided is the completion of Red Wave “2” at 0.63649, signaling the conclusion of the corrective wave and the commencement of a new impulsive phase. This is a pivotal juncture for traders to identify potential entry points as they anticipate the continuation of the uptrend.
In addition, the analysis introduces the concept of the first bullish confirmation at 0.66183, providing traders with a specific level to monitor for evidence of a strengthening bullish trend.
Conversely, the Wave Cancel invalid level is denoted as 0.63651. This level serves as a reference point for traders to assess the validity of the analysis and make adjustments if necessary.
In conclusion, the AUDUSD Elliott Wave Analysis for 29 August 23, furnishes traders with invaluable insights into implementing impulsive trend trading strategies within a newly emerging uptrend. The identification of key elements such as Function, Mode, Structure, Position, Direction, and critical levels empowers traders to make well-informed trading decisions. Nonetheless, traders are encouraged to complement this analysis with additional technical and fundamental indicators while adhering to effective risk management practices for a holistic trading approach.
More By This Author:
Commodities And Futures Trading Markets: Bonds, Dollar, Gold Silver, Copper...
Elliott Wave Technical Analysis: NEO/U.S. Dollar - Monday, August 28
Elliott Wave Technical Analysis: Intuit Inc. - Monday, August 28


Comments
Log in or sign up to join the conversation.