

Photo by Claudio Schwarz on Unsplash
USD/CHF Elliott Wave Analysis TradingLounge 4 Hour Chart, 9 August 2023.
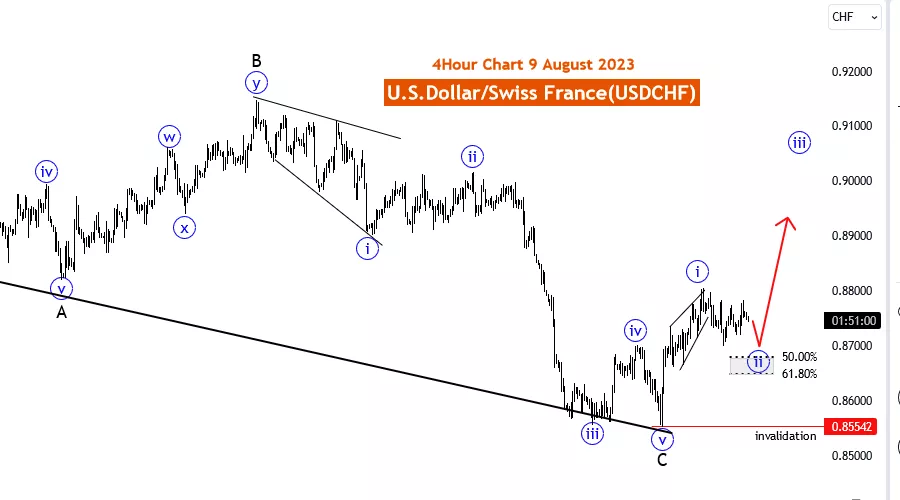
U.S. Dollar/Swiss Franc (USD/CHF) 4 Hour Chart
USD/CHF Elliott Wave Technical Analysis
Function: Counter Trend
Mode: Corrective
Structure: Blue wave 2
Position: New Black Wave 1
Direction Next higher Degrees: wave (3 of 1)
Details: Blue corrective wave 2 likely to end at fib level 50.00 to 61.80 . Wave Cancel invalid level: 0.85542
On 9th August 23, the 4-hour chart of the U.S. Dollar/Swiss Franc (USD/CHF) pair undergoes Elliott Wave analysis, indicating a counter-trend movement with a corrective mode. The function of the price movement is identified as counter-trend, while the mode is characterized as corrective.
The current structure is recognized as a Blue wave 2, with the position of the price wave designated as the New Black Wave 1. The projected direction for the next higher degrees is wave (3 of 1), suggesting that this corrective wave movement is part of a larger impulsive wave pattern.
The analysis provides further details, suggesting that the Blue corrective wave 2 is likely to end within the Fibonacci retracement level range of 50.00 to 61.80. Traders and investors are advised to closely monitor the market, as the completion of the corrective wave 2 will mark a potential turning point in the price movement.
It is essential to note that the wave count provided will lose its validity if the USD/CHF price exceeds the level of 0.85542.
As of the specified date, 9th August 23, traders in the USD/CHF market should closely observe the counter-trend corrective movement and anticipate the completion of the Blue corrective wave 2. Counter-trend trading involves higher risks, and traders should exercise caution and implement effective risk management practices.
The analysis also suggests the potential for a new impulsive wave pattern to emerge after the completion of the corrective wave. Traders should be alert for potential trend reversal signals and confirmation of the new uptrend before considering long positions.
While Elliott Wave analysis provides valuable insights into potential market patterns and price movements, traders should supplement it with other technical indicators and fundamental factors to create a comprehensive trading strategy. Market conditions can change rapidly due to various factors, including economic data releases, geopolitical events, and shifts in market sentiment. Therefore, traders should remain attentive and adaptable to changing market conditions.
Proper risk management practices are essential in all trading endeavors to protect capital and manage potential losses. By staying informed and utilizing a well-rounded approach to trading, traders can make more informed decisions and enhance their trading performance in the dynamic foreign exchange markets.
More By This Author:
Elliott Wave Technical Analysis: Ethereum/U.S. Dollar - Wednesday, Aug. 9
Elliott Wave Technical Analysis: Monster Beverage, Tuesday, Aug. 8
Elliott Wave Technical Analysis: AAVE Token/U.S. Dollar Aug, 8


Comments
Log in or sign up to join the conversation.