

Photo by Colin Watts on Unsplash
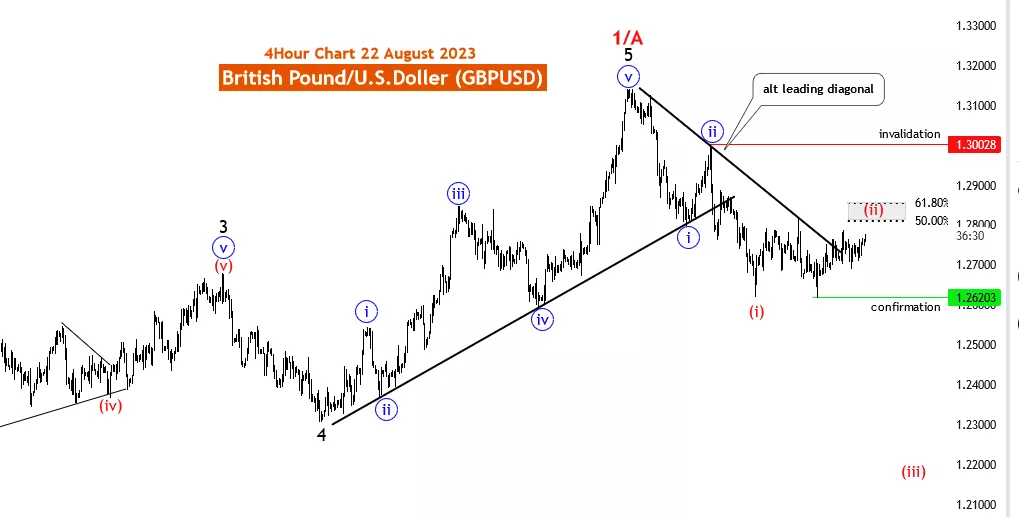
GBPUSD Elliott Wave Analysis Trading Lounge 4 Hour Chart, 22 August 2023
British Pound/U.S.Dollar (GBPUSD) 4 Hour Chart
GBPUSD Elliott Wave Technical Analysis
Function: Counter Trend
Mode: corrective
Structure: subwave 2 of 3
Position: Blue wave 3
Directioext lower Degrees: wave 3 of 3
Details: Red Corrective Wave “2” likely to end between fib level 50.00 to 61.80 .wave 3 confirmation level at 1.26203. Wave Cancel invalid level: 1.30028
The GBPUSD Elliott Wave analysis for August 22, 2023, delves into the 4-hour chart, providing a comprehensive view of the counter-trend corrective movement within the context of subwave 2 of 3. This analysis holds vital insights for traders aiming to leverage short-term market dynamics and make informed trading decisions.
The counter-trend corrective movement discussed in this analysis is a critical aspect for traders to monitor, as it presents opportunities to capitalize on price reversals within an overarching market trend. Understanding and interpreting these patterns empowers traders to navigate short-term market fluctuations with precision.
The focus of this analysis is on subwave 2 of 3, specifically within the context of blue wave 3. Subwave structures are essential components of Elliott Wave theory, often indicating potential turning points and setting the stage for significant price movements.
The completion of the red corrective Wave 2 is a pivotal moment, signifying the conclusion of a corrective phase and the commencement of a new wave. In this case, the correction is anticipated to end between the fib level 50.00 to 61.80, highlighting a potential price range where this corrective movement may conclude.
Moreover, the analysis emphasizes the imminent start of wave 3, suggesting a continuation of the corrective movement. Understanding the dynamics of wave patterns aids traders in anticipating market movements, setting appropriate entry and exit points, and managing risk effectively.
Traders are advised to closely watch for the confirmation of wave 3, which is projected to occur at the 1.26203 level. This confirmation serves as a significant trigger for traders, helping them validate their analysis and decisions.
The Wave Cancel invalid level at 1.30028 is a critical point to consider, as breaching this level could prompt traders to reevaluate their analysis and strategies, potentially leading to adjustments in trading plans.
To sum up, the GBPUSD Elliott Wave analysis for 22 August 23, highlights the importance of counter-trend corrective movements within the context of subwave 2 of 3. By understanding these patterns, traders can navigate short-term market volatility, seize opportunities during corrective phases, and make well-informed trading choices. While this analysis provides valuable insights, traders are encouraged to complement it with additional market data, fundamental analysis, and sentiment indicators to develop a comprehensive trading approach.
More By This Author:
Global Stock Indices - Elliott Wave Technical Analysis
Elliott Wave Technical Analysis Day Chart: Australian Dollar/Japanese Yen - Monday, Aug. 21
Elliott Wave Technical Analysis 4 Hour Chart: Australian Dollar/Japanese Yen - Monday, Aug. 21


Comments
Log in or sign up to join the conversation.