
Elliott Wave Technical Analysis 4 Hour Chart: Australian Dollar/U.S. Dollar

Image Source: Unsplash
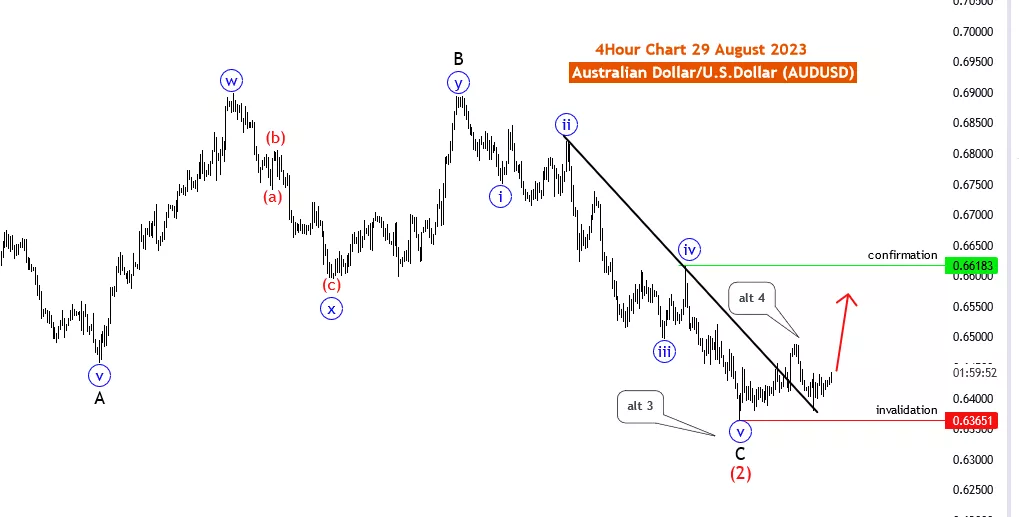
AUDUSD Elliott Wave Analysis Trading Lounge 4 Hour Chart, 29 August 2023
Australian Dollar/U.S.Dollar (AUDUSD) 4 Hour Chart
AUDUSDElliott Wave Technical Analysis
Function: Trend
Mode: impulsive
Structure: new impulsive
Position: Red wave 3
Direction Next Higher Degrees: After blue wave 5 of C of 2 new uptrend looking Started Details: Red Wave “2” looking completed at 0.63649, new impulsive for uptrend started. Wave Cancel invalid level: 0.63651
The AUDUSD Elliott Wave Analysis for 29 August 23, focuses on the 4-hour chart of the Australian Dollar/U.S. Dollar currency pair. This analysis provides insights into impulsive trend trading strategies within a newly emerging uptrend.
The central emphasis of this analysis lies in identifying the Function as Trend. This signifies that the current market conditions are conducive to a sustained and directional price movement. This is of paramount importance for traders, as they seek to capitalize on the prevailing market momentum.
The Mode is identified as impulsive, indicating that the expected price movement is likely to be characterized by strong and decisive momentum. This aligns with the concept of impulsive trading strategies, where traders aim to capture substantial price movements within a relatively short time frame.
The analysis points out the Structure as new impulsive, suggesting the emergence of a fresh impulse wave. This information is critical for traders as it allows them to gauge the strength and longevity of the upcoming price movement, aiding in effective trade management.
The Position is highlighted as Red wave 3, indicating the current wave count and position within the broader wave structure. This knowledge is essential for traders, as it helps in understanding the broader context of the market and identifying potential turning points.
Moreover, the Direction Next Higher Degrees is specified as After blue wave 5 of C of 2 new uptrend looking Started. This indicates the beginning of a new uptrend following a corrective phase. Understanding the directional shift is crucial for traders to adapt their trading strategies accordingly.
A key insight provided is the completion of Red Wave “2” at 0.63649, signaling the end of the corrective wave and the commencement of a new impulsive phase. This is a crucial point for traders to identify potential entry points as they anticipate the continuation of the uptrend.
Importantly, the Wave Cancel invalid level is mentioned as 0.63651. This level serves as a reference point for traders to assess the validity of the analysis and make adjustments if necessary.
In conclusion, the AUDUSD Elliott Wave Analysis for 29 August 23, presents traders with valuable insights into implementing impulsive trend trading strategies within a newly emerging uptrend. By identifying key elements such as the Function, Mode, Structure, Position, Direction, and significant levels, traders can make well-informed trading decisions. However, traders are encouraged to supplement this analysis with additional technical and fundamental indicators, while adhering to effective risk management practices for a comprehensive trading approach.
More By This Author:
Commodities And Futures Trading Markets: Bonds, Dollar, Gold Silver, Copper...
Elliott Wave Technical Analysis: NEO/U.S. Dollar - Monday, August 28
Elliott Wave Technical Analysis: Intuit Inc. - Monday, August 28
Analyst Peter Mathers TradingLounge™ Australian Financial Services Licence - AFSL 317817


