
(Click on image to enlarge)
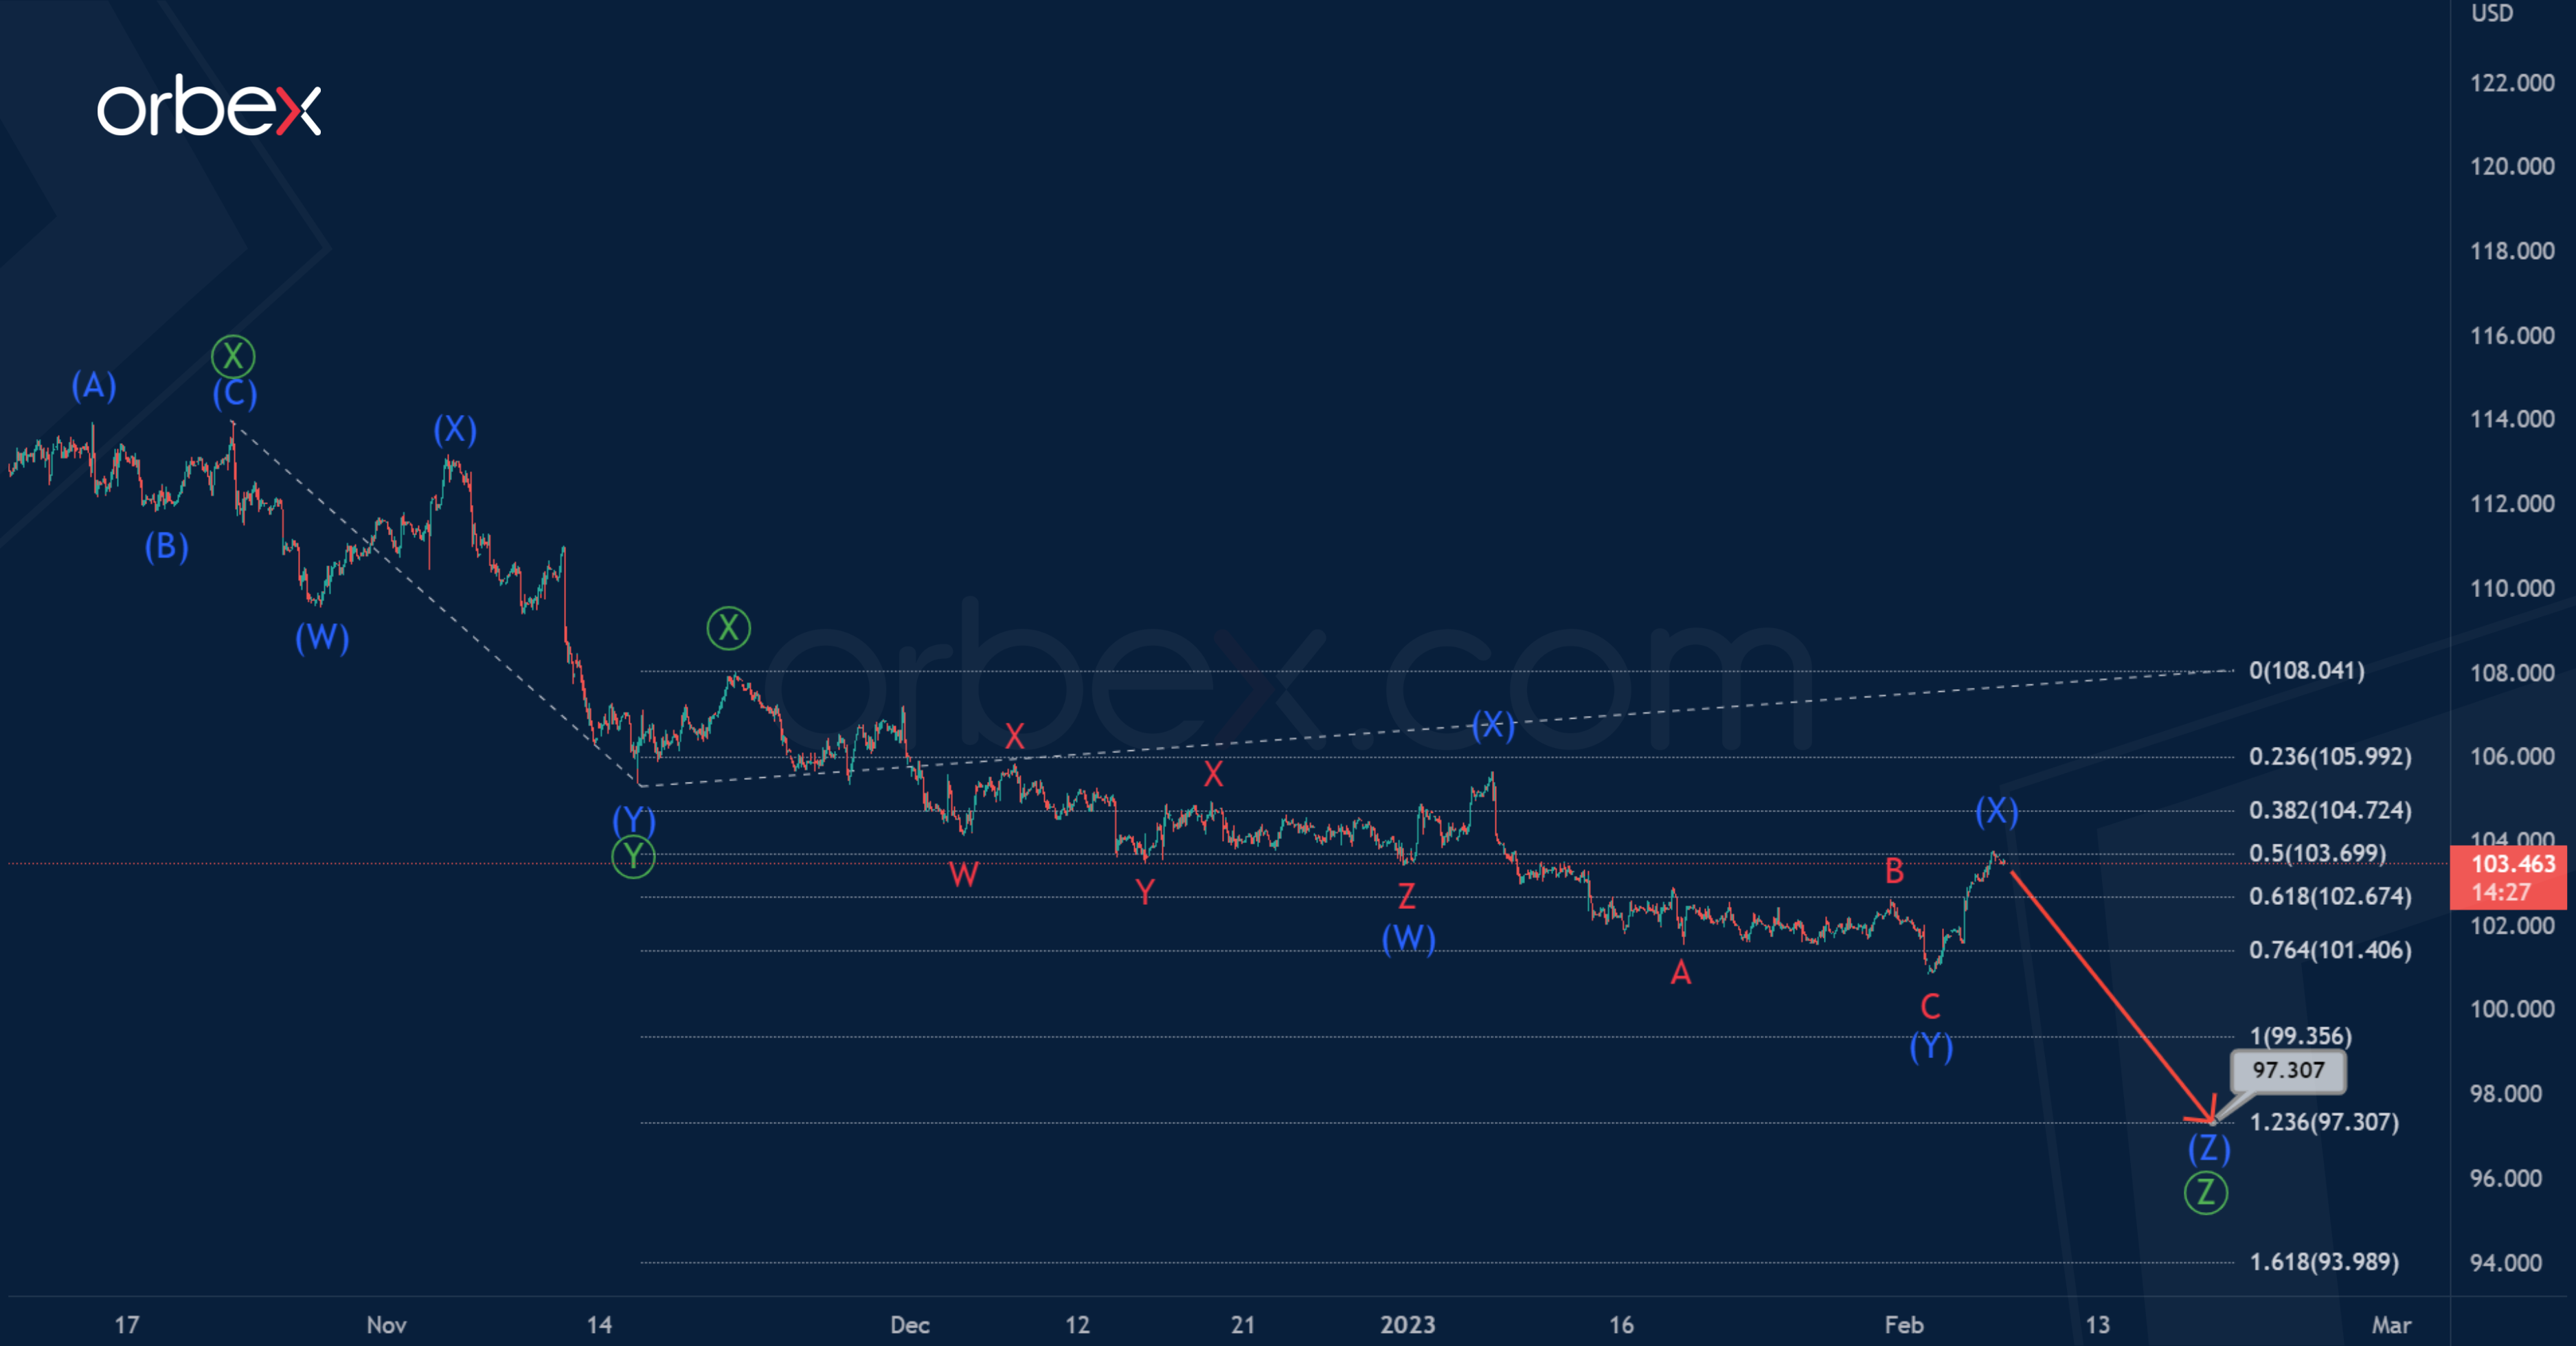
The current DXY structure suggests we are at the end of a global corrective trend.
This is in the form of a triple zigzag pattern Ⓦ-Ⓧ-Ⓨ-Ⓧ-Ⓩ. It seems that the sub-waves Ⓦ-Ⓧ-Ⓨ-Ⓧ have ended.
In the near future, the price depreciation is expected to continue in the primary wave Ⓩ. It is also like the intermediate triple zigzag (W)-(X)-(Y)-(X)-(Z). The market is now in the sub-wave (Z).
The price could fall to 97.307. At that level, wave Ⓩ will be at 123.6 % of wave Ⓨ.
(Click on image to enlarge)

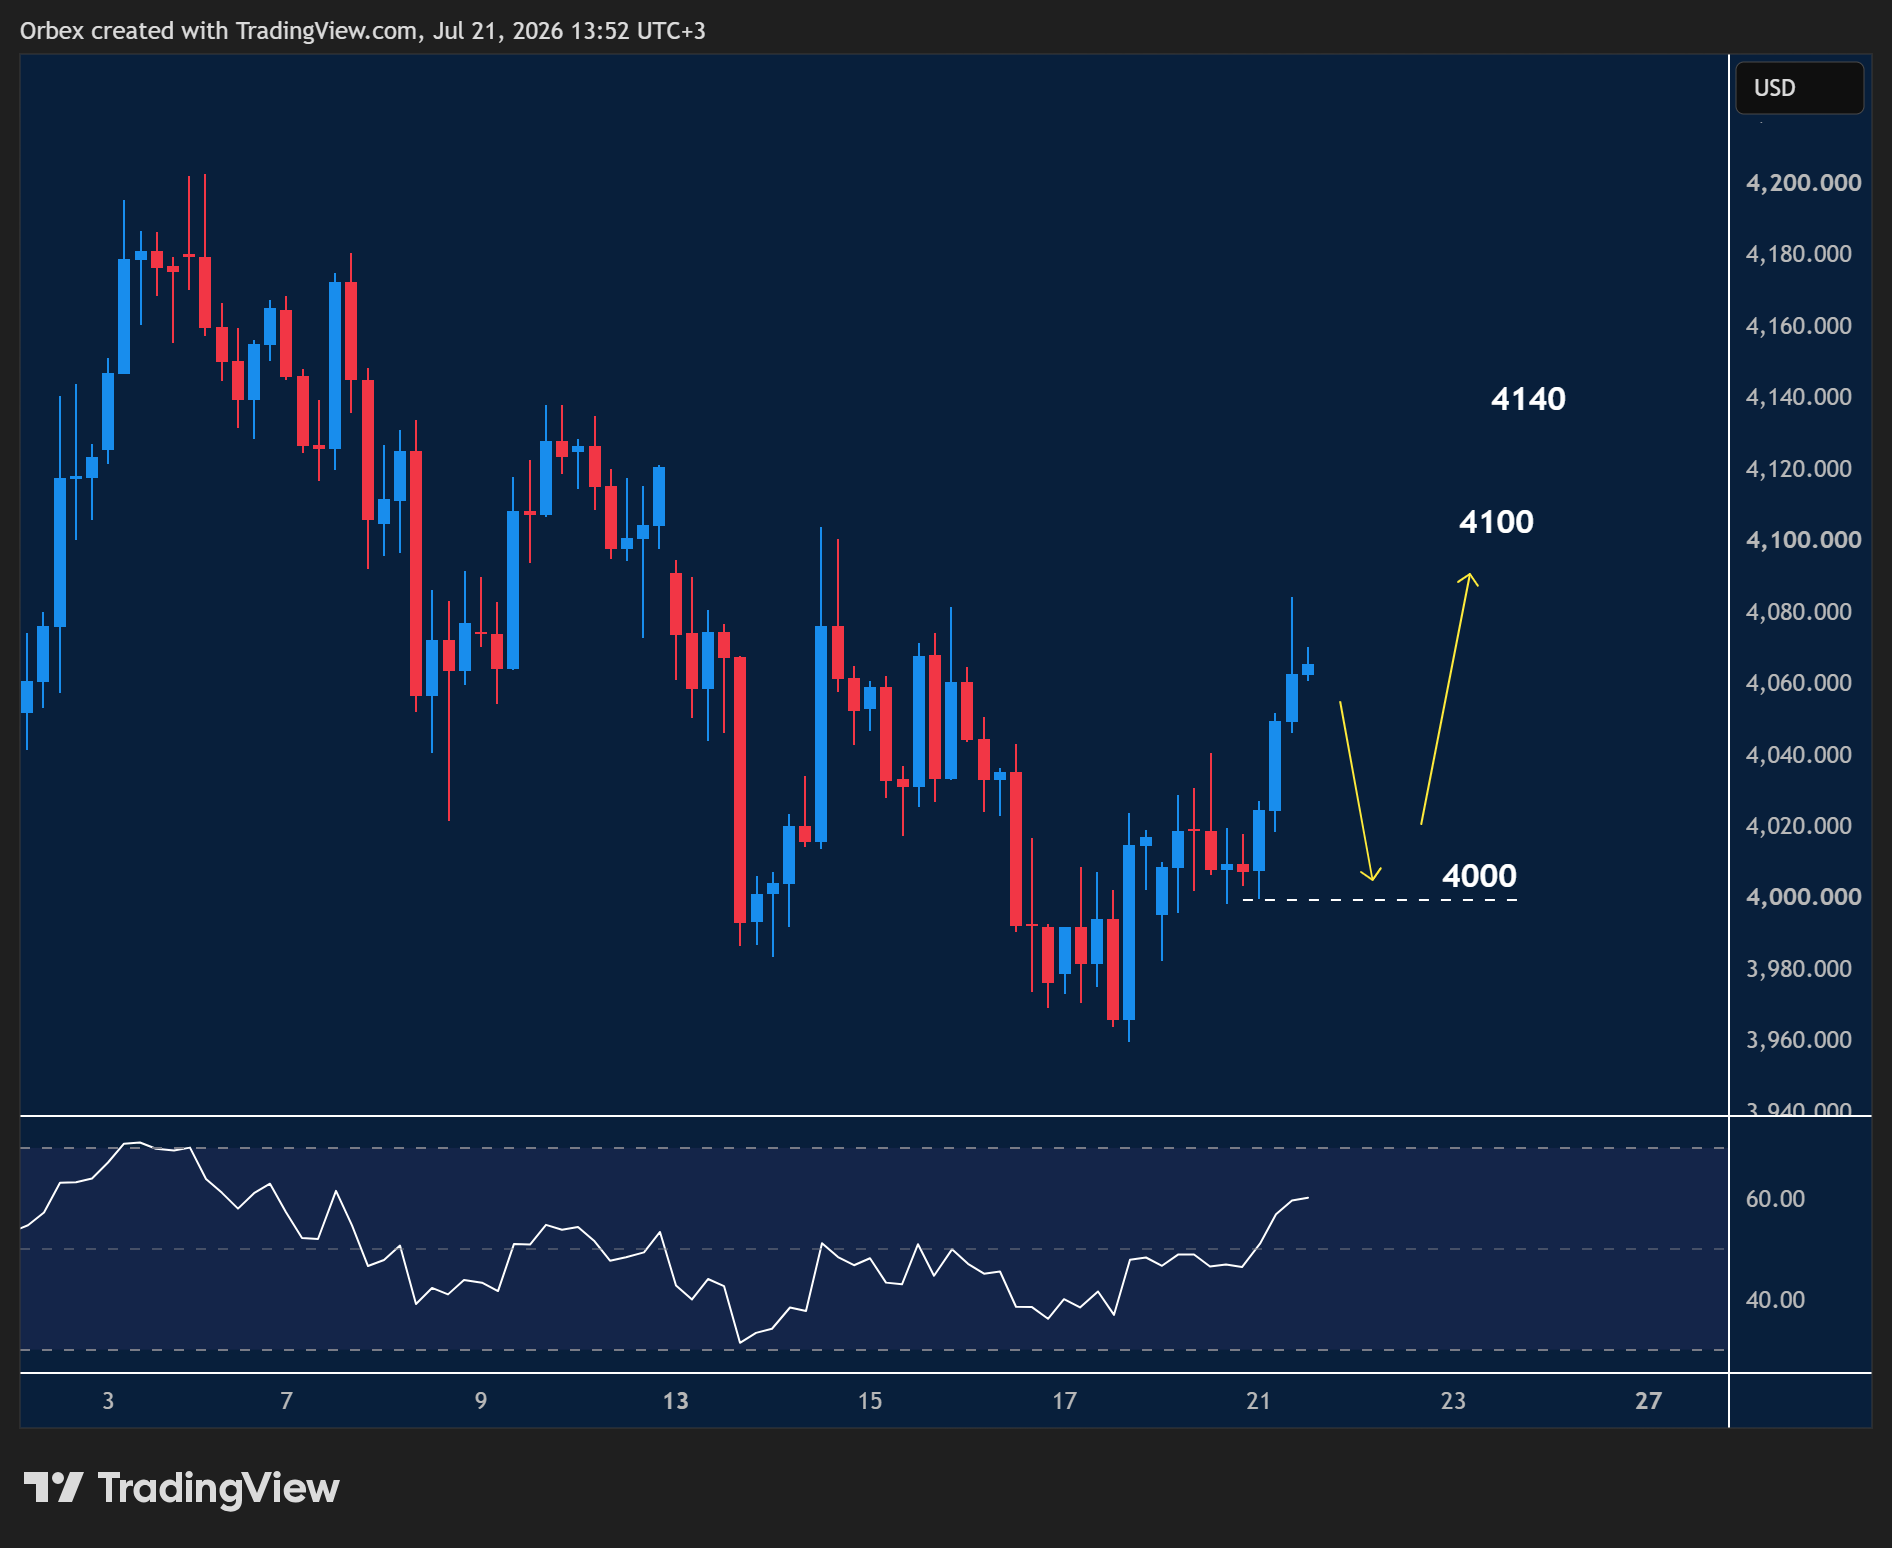
Let’s consider an alternative scenario in which the last part of the bullish correction trend is being built. This is a triple zigzag w-x-y-x-z.
Wave final wave z can take the form of a zigzag Ⓐ-Ⓑ-Ⓒ. The first impulse Ⓐ and the correction Ⓑ in the form of an intermediate double zigzag are already completed.
The entire wave z could end near 115.75. At that level, it will be at the 76.4% Fibonacci extension of wave y.
More By This Author:
Possible Market Implications For Chinese Balloon
USDCHF: Skewed Triangle Completion
Intraday Analysis – USD Recovers Lost Ground


Comments
Log in or sign up to join the conversation.