
USDCHF: Skewed Triangle Completion
(Click on image to enlarge)
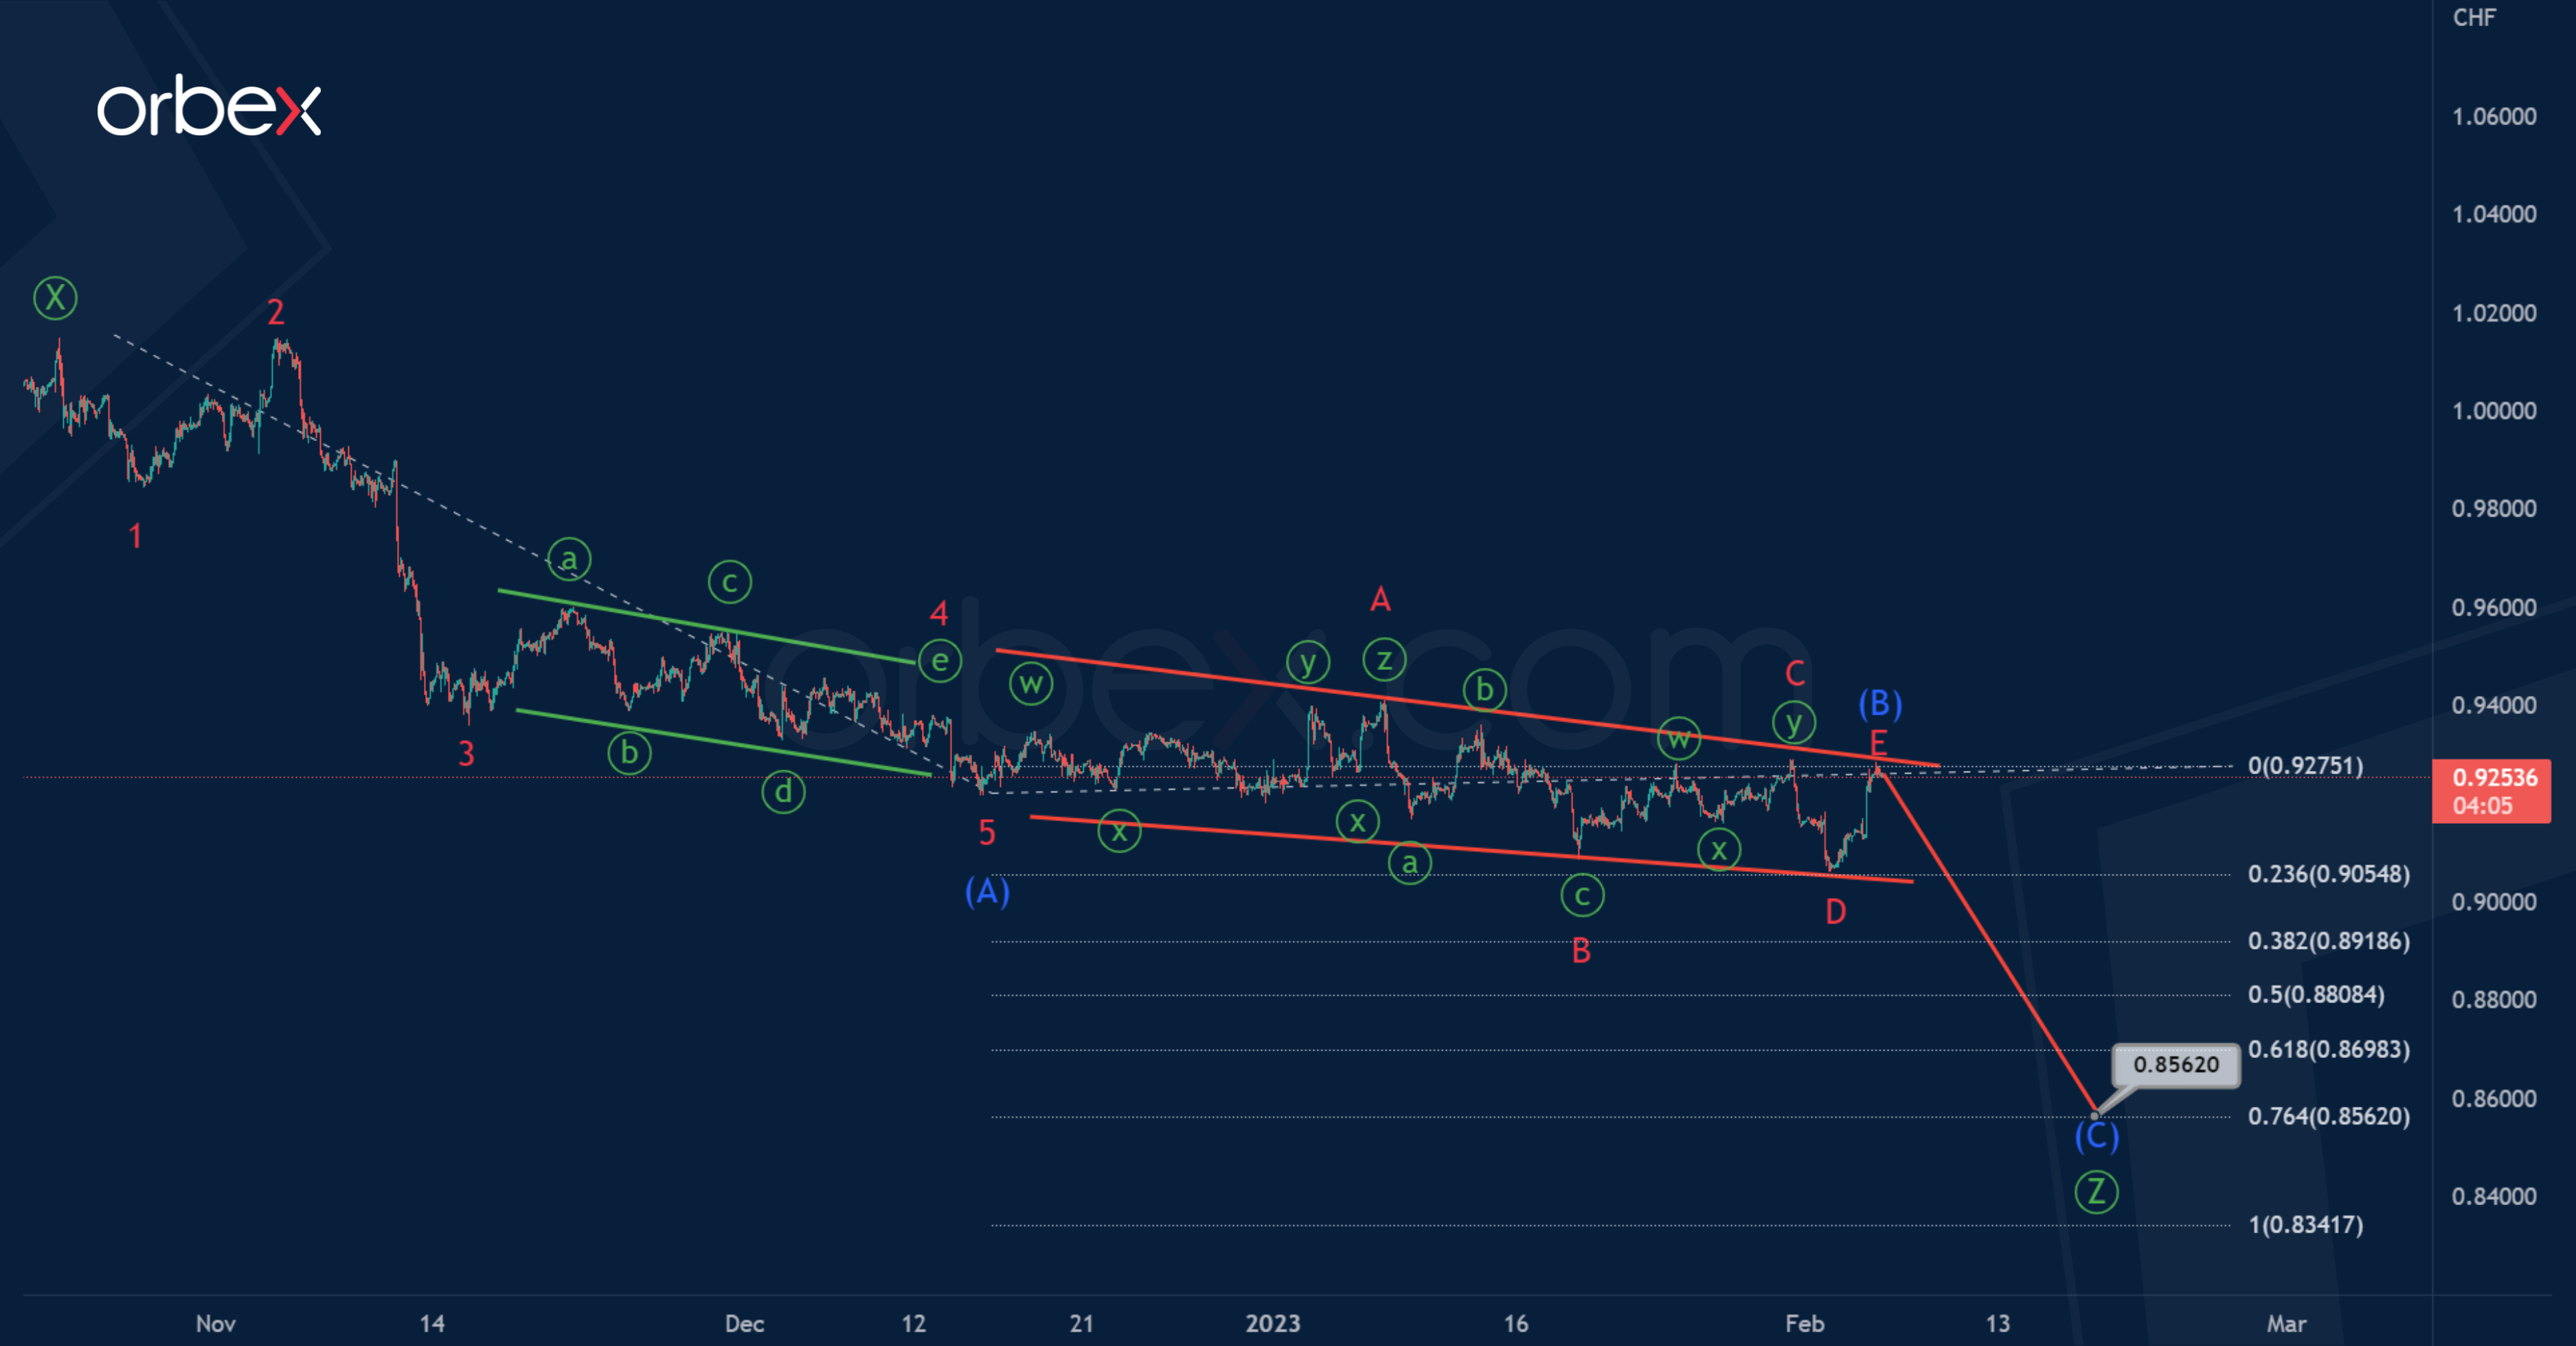
In the long term, the USDCHF pair is building a primary corrective triple zigzag Ⓦ-Ⓧ-Ⓨ-Ⓧ-Ⓩ. The final wave Ⓩ is under development and could end in the form of a standard intermediate zigzag (A)-(B)-(C). Wave (A) is a 5-wave bearish impulse, and wave (B) is a skewed triangle that looks finished.
Usually, after the end of a skewed triangle, the trend continues to move in the same direction. Thus, the final intermediate wave (C) formation can be expected in the near future.
Using the Fibonacci extension, the potential end of the wave (C) is determined. It will most likely be at 76.4% of impulse (A), and will end near 0.856.
(Click on image to enlarge)
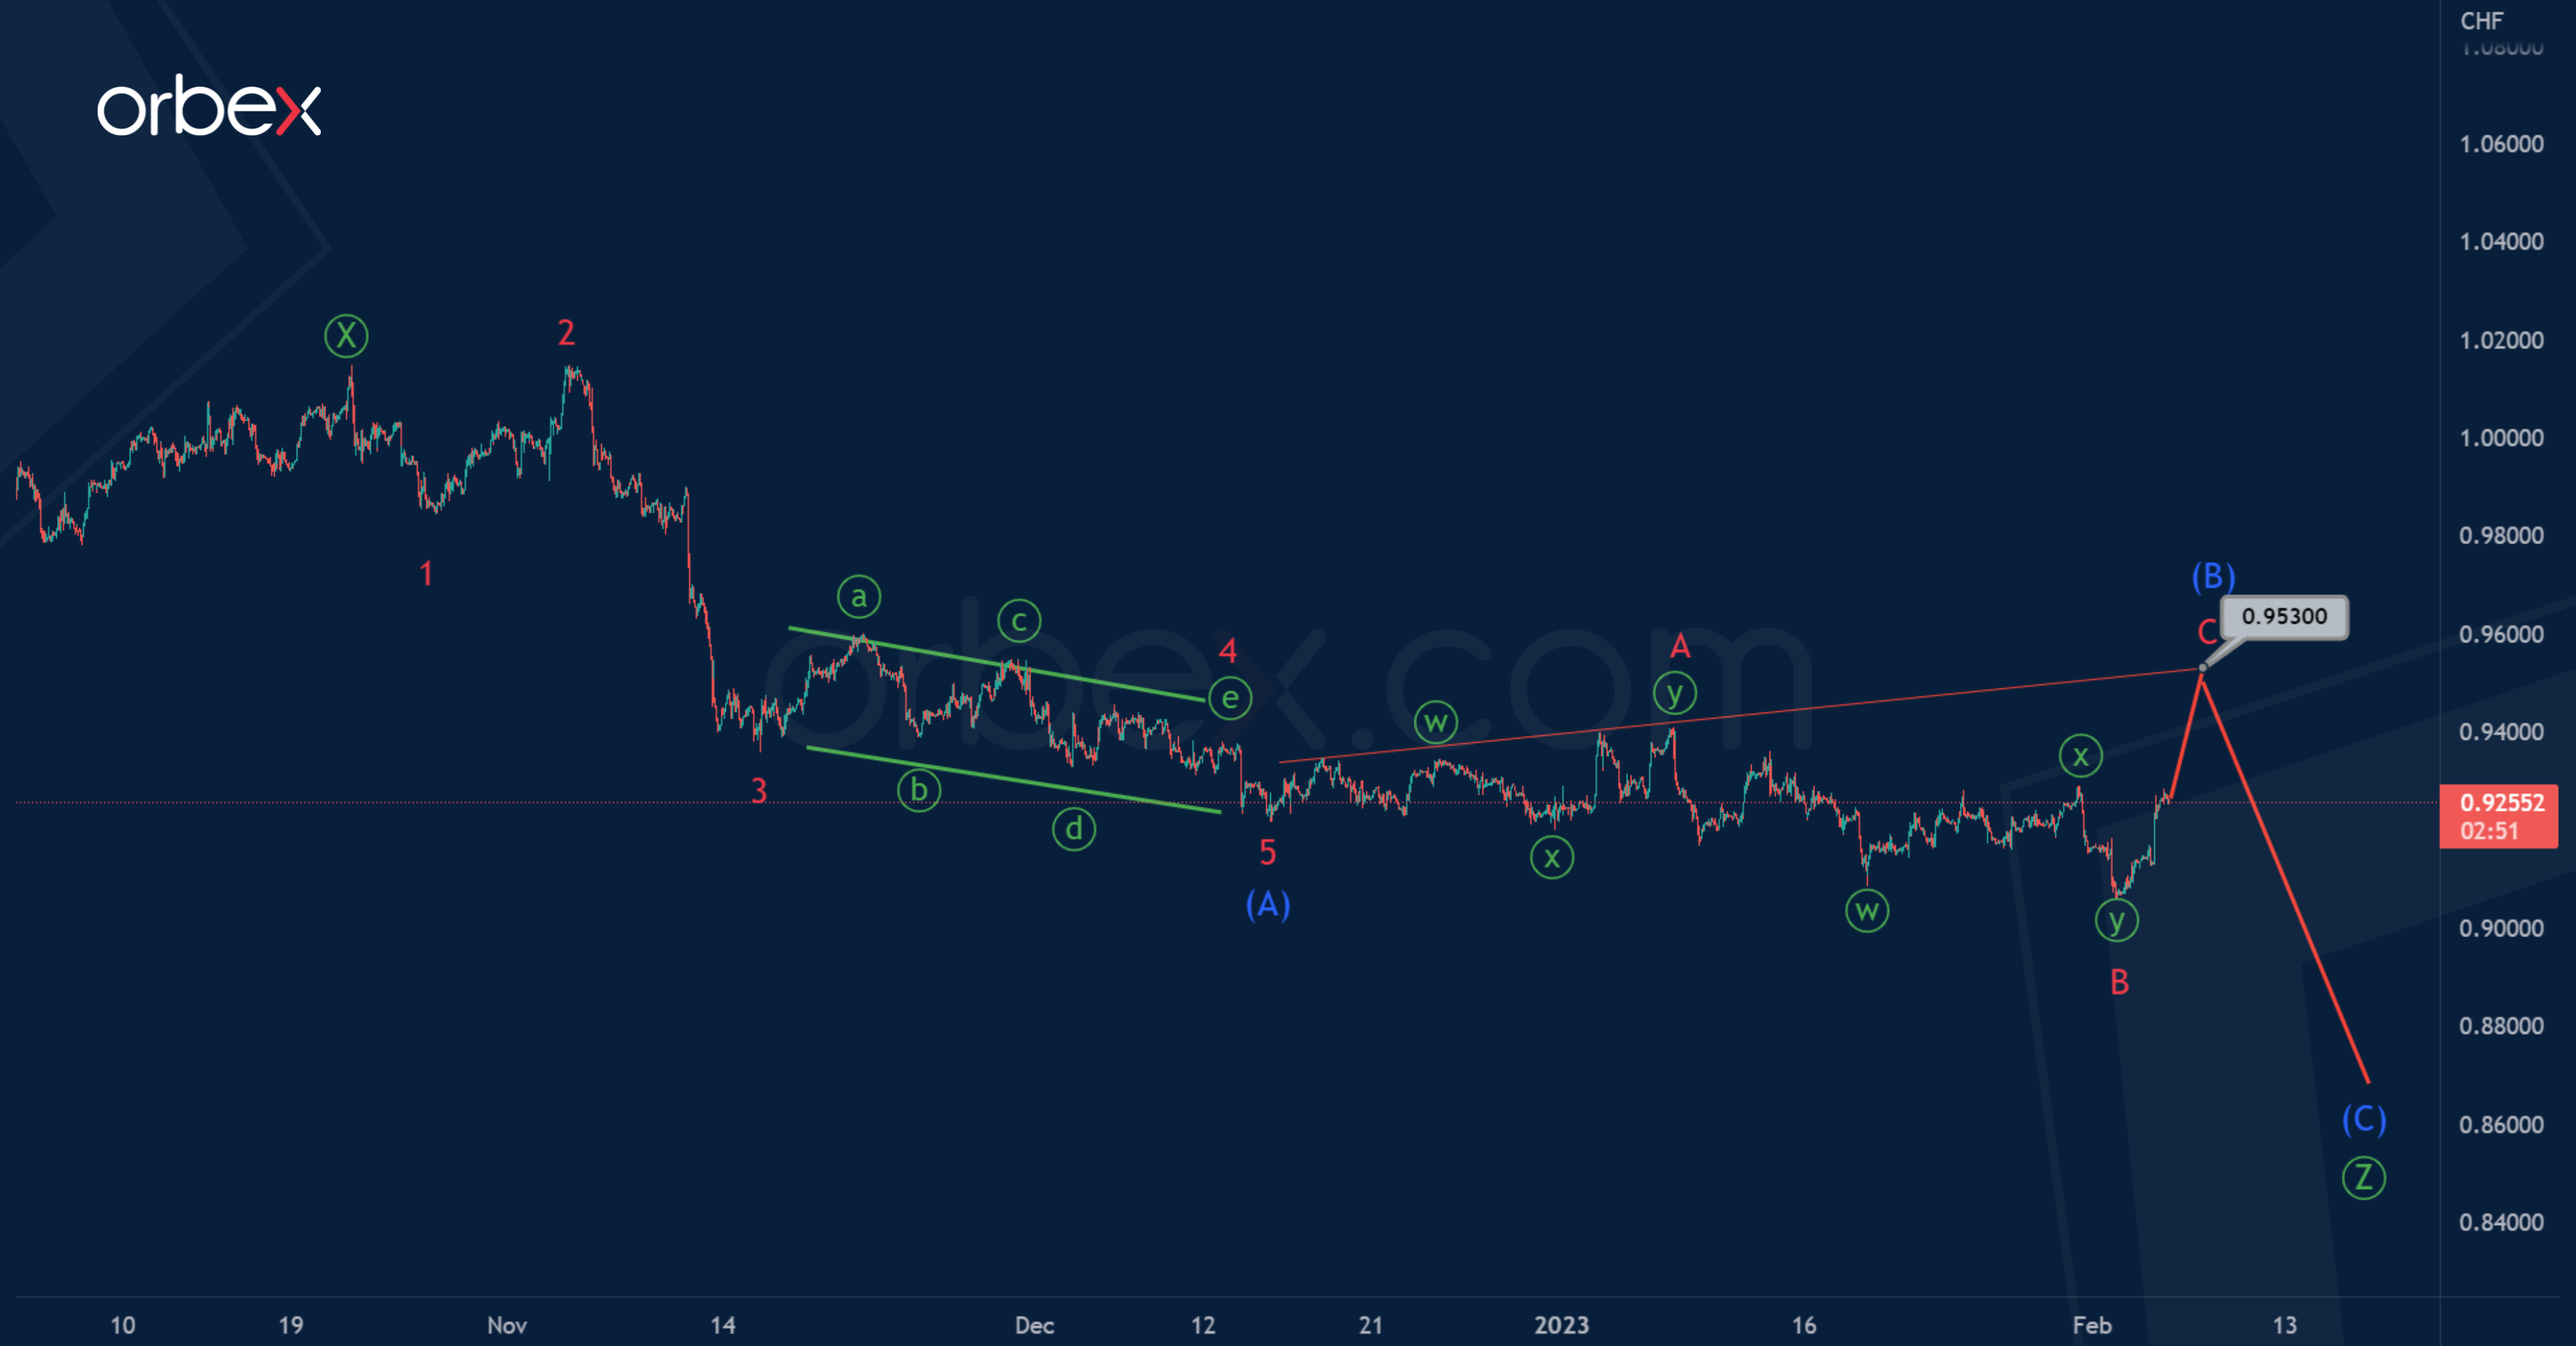
Let’s look at an alternative scenario. According to this view, the development of correction (B) can be continued. Perhaps it takes the form of a flat A-B-C.
At the moment, the minor sub-waves A and B have ended. Both of these sub-waves are similar to double zigzags of the minute degree ⓦ-ⓧ-ⓨ.
To confirm this scenario, the final impulse wave C is needed. It is likely that the impulse C will end near 0.953, located on the resistance line.
More By This Author:
The Week Ahead – Turning The Corner
RBA To Hike After Worrying Signs For Economy
Amazon: Bearish Impulse To End Wave Ⓐ Near 72.04
Disclaimer: Orbex LIMITED is a fully licensed and Regulated Cyprus Investment Firm (CIF) governed and supervised by the Cyprus Securities and Exchange Commission (CySEC) (License Number ...
more

