
Consider the ten year Treasury yield and the dollar index (DXY) over the past six months:
(Click on image to enlarge)
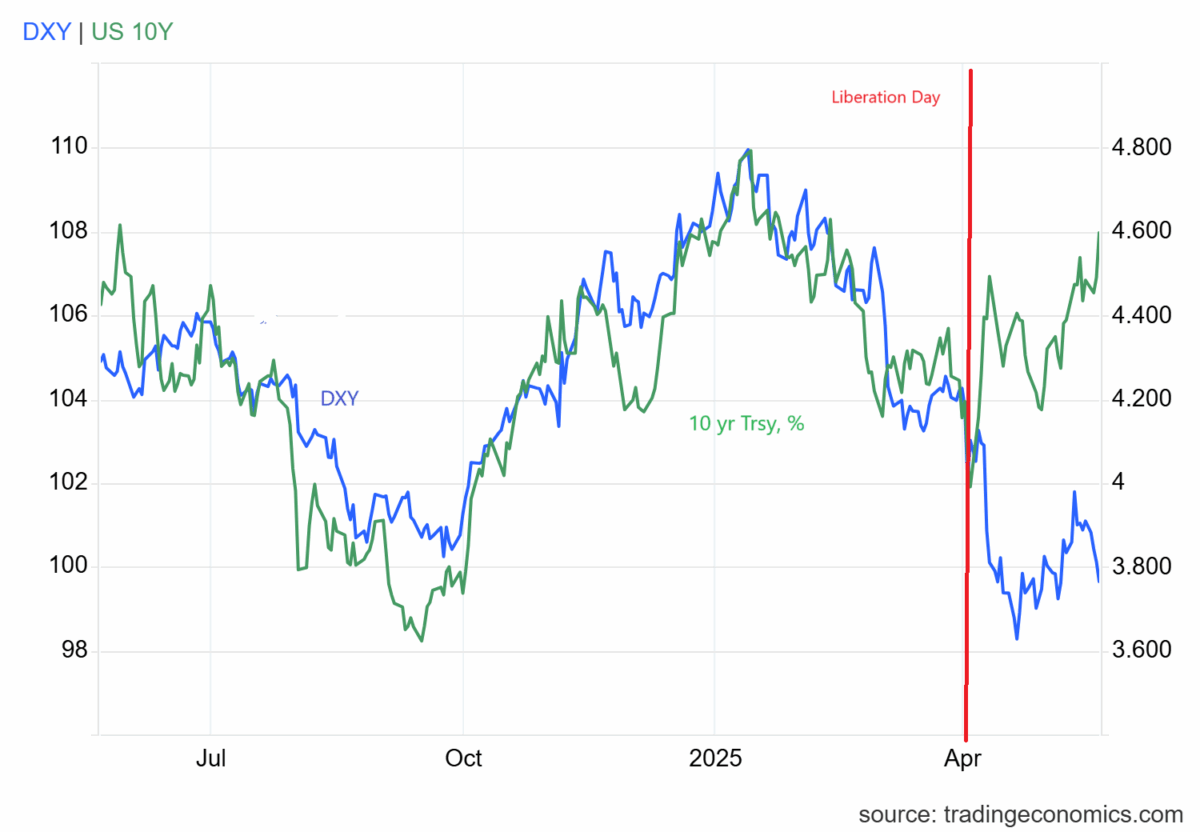
Figure 1: DXY (blue, left scale), and ten year Treasury yield, % (green, right scale). Red line at “Liberation Day” (April 2). Source: TradingEconomics accessed 21 May 2025 3pm CT.Is th
First obvious episode is in the wake of Liberation Day. The second is … ongoing.
Is there any wonder? Given how the fiscal plans are playing out, it would be surprising if there wasn’t some unrest.
(Click on image to enlarge)
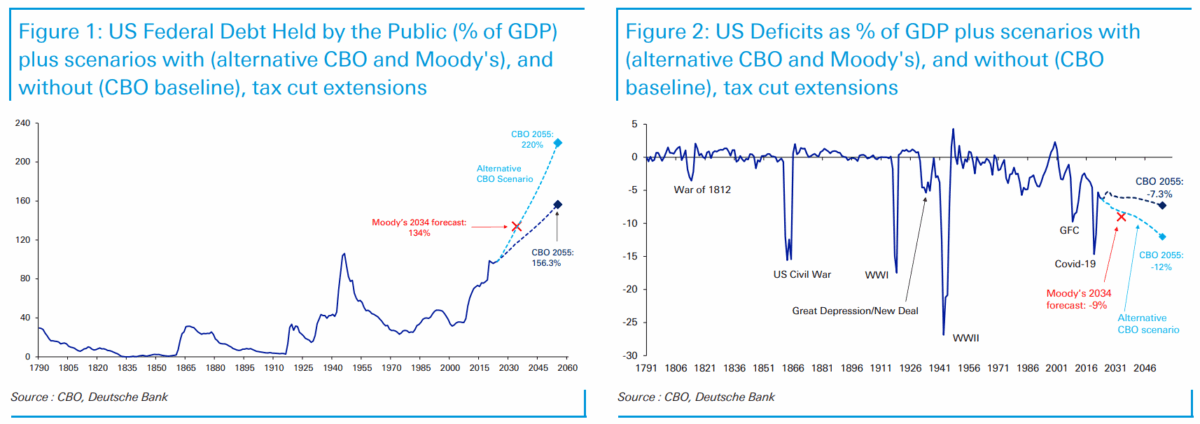
Source: Reid, CoTD, DeutscheBank, May 19, 2025.
More By This Author:
Sentiment, Confidence, News
NABE 2025 Growth Outlook Downgraded From 1.9% (April) to 1.3% (May)
Thoughts On Soft Vs. Hard Data


Comments
Log in or sign up to join the conversation.