

Image Source: Pexels
Asian stocks continued to decline following Wall Street's downturn on Wednesday as President Donald Trump appeared poised to move forward with hefty 104% tariffs on Chinese products. This situation has driven oil prices down to four-year lows, fueling global recession concerns that are affecting financial markets. Washington confirmed that a 104% tariff on imports from China would be implemented after midnight on Wednesday. The news regarding tariffs and the possibility of an extended trade conflict between the two largest economies in the world led to significant volatility in financial markets. The S&P 500 experienced one of its most dramatic turnarounds in nearly 50 years, with the benchmark index dropping 4.2 percentage points from an initial positive start to end in negative territory. Consequently, the index has seen a decline of $5.8 trillion in market value, marking the largest four-day loss since its inception in the 1950s.
The sense of improved stability observed during the European session on Tuesday shifted significantly since the close in London yesterday. While Monday's chaos primarily affected equities, the notable issue on early Wednesday is the rise in bond yields. Nevertheless, equities are also facing challenges, with the Nikkei reversing most of Tuesday’s gains after US indices ended the day lower. In US Treasuries (USTs), the most significant development is the steepening of the yield curve, with the 30-year yield briefly surpassing 5%. A 3-year UST auction that tailed by 2.4bps, clearing at 3.784%, did not help the situation, but pressure is particularly seen on the long end of the curve. From last Friday’s low of 4.30%, the current 30-year UST rate has risen to about 4.90%, an increase of approximately 60bps, with the steepness of the 2s30s UST curve up around 50bps since Liberation Day. The front end may have some support from growing expectations that the Fed might intervene to cut rates, although this is still widely debated. A concern on the longer end of the curve is that USTs no longer appear to be the safe-haven asset typically sought in risk-off environments. This may be partly attributed to the inflationary impact of tariffs, but other factors could also be influencing this change (e.g. unwinding of basis trades, evolving views on US policy credibility). Looking ahead, China seems unlikely to avoid the full impact of tariffs with the 104% rate kicking in overnight. Overall, market sentiment is likely to be reactive to the outcomes of negotiations with other countries, such as Japan, South Korea, and Taiwan, regarding reduced tariffs. However, it may take some time for these narratives to materialize, leading to the swift fading of yesterday’s brief reprieve for risk assets.
The global trade shock highlights the UK's fiscal risks as the yield curve steepens. The 10-year gilt yield, at 4.60% yesterday, mirrors pre-Liberation Day levels, but the curve from 10s to 30s has steepened abnormally since April 3. The 5-year yield rebounded after dropping post-April 2. This steepening reflects increased fiscal risk premiums, not inflation concerns. While US trade policy changes raise questions about UK fiscal capacity, their direct impact appears minimal. However, global economic risks could worsen fiscal challenges. Even before US tariffs, doubts surrounded the Office for Budget Responsibility's fiscal headroom estimates. The trade shock further strains fiscal leeway, justifying added term premiums. The government’s narrow margin against its fiscal rule remains vulnerable, with the 30-year yield only 10 basis points below January’s peak.
Aside from trade tariff updates, today’s data slate includes: FOMC Minutes, ECB’s Knot and Cipollone Speeches, Fed’s Barkin Remarks.
Overnight Newswire Updates of Note
- US-China Brawl Takes Center Stage In Global Trade War
- Trump: US Taking In $2B A Day From Tariffs
- Trump Launches Last-Ditch Crusade To Rescue Coal
- Trump Assures GOP Budget Holdouts On Spending Cuts
- Republicans Fracture Over How Much Debt To Run Up For Tax Cuts
- JPM Model Shows Recession Fear Spiking Up To 79%
- Bond Rout Starting To Sound Market Alarm Bells
- ADB: US Tariffs To Significantly Impact Economies In Asia
- Citi Cuts China GDP Growth Forecast To 4.2% From 4.7% For 2025
- China’s LGFVs Mark A Low For Net Financing At Start Of Year
- RBNZ Cuts Cash Rate Target By 25bps To 3.50%; As Expected
- RBI Cuts Policy Rate By 25 Basis Points To 6% To Boost Growth
FX Options Expiries For 10am New York Cut
(1BLN+ represents larger expiries, more magnetic when trading within daily ATR)
- EUR/USD: 1.0900 (1.9BLN), 1.0925 (613M), 1.0950-60 (1.3BLN)
- 1.0975-80 (1.1BLN), 1.1000 (1.2BLN), 1.1015-25 (1.3BLN), 1.1050-60 (1.5BLN)
- 1.1100 (472M)
- USD/CHF: 0.8360 (200M), 0.8445 (280M)
- GBP/USD: 1.2750 (445M), 1.2900 (224M), 1.2930 (213M), 1.3050 (470M)
- AUD/USD: 0.5900 (424M), 0.5975 (725M), 0.6010 (417M), 0.6050-55 (509M)
- USD/JPY: 143.55 (1.4BLN), 144.00 (500M), 145.00 (776M), 145.70 (350M)
- 146.00 (675M), 146.50 (565M), 146.70-80 (1.5BLN), 147.00 (716M)
- 147.50 (1.3BLN)
- EUR/JPY: 161.85-95 (690M), 162.90 (618M)
- USD/CAD: 1.4100 (670M), 1.4280 (437M), 1.4320 (335M), 1.4400 (500M)
CFTC Data As Of 4/4/25
- British pound net long position is 34,626 contracts.
- Euro net long position is 51,835 contracts
- Japanese yen net long position is 121,774 contracts
- Bitcoin net long position is 491 contracts
- Swiss franc posts net short position of -42,764 contracts
- Speculators trim CBOT US Treasury bonds futures net short position by 5,627 contracts to 32,648
- Speculators increase CBOT US Ultrabond Treasury futures net short position by 21.663 contracts to 254,029
- Speculators increase CBOT US 2-Year Treasury futures net short position by 44,805 contracts to 1,226,391
- Speculators increase CBOT US 10-Year Treasury futures net short position by 53,173 contracts to 863,263
- Speculators increase CBOT US 5-Year Treasury futures net short position by 121,590 contracts to 2,021,677
- Fund Managers cut S&P 500 CME net long position by 37,007 contracts to 878,833
- Equity Fund Speculators increase S&P 500 CME net short position by 28,330 contracts to 265,197
Technical & Trade Views
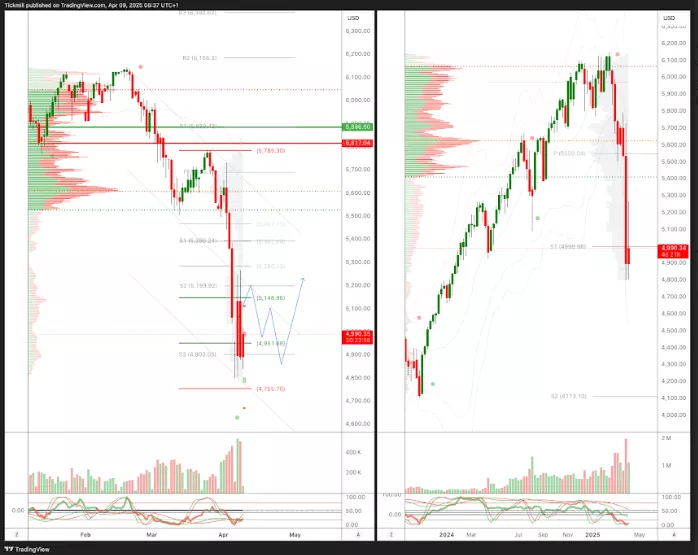
SP500 Pivot 5790
- Daily VWAP bearish
- Weekly VWAP bearish
- Seasonality suggests bullishness into late April
- Above 5245 target 5400
- Below 4951 target 4755
(Click on image to enlarge)
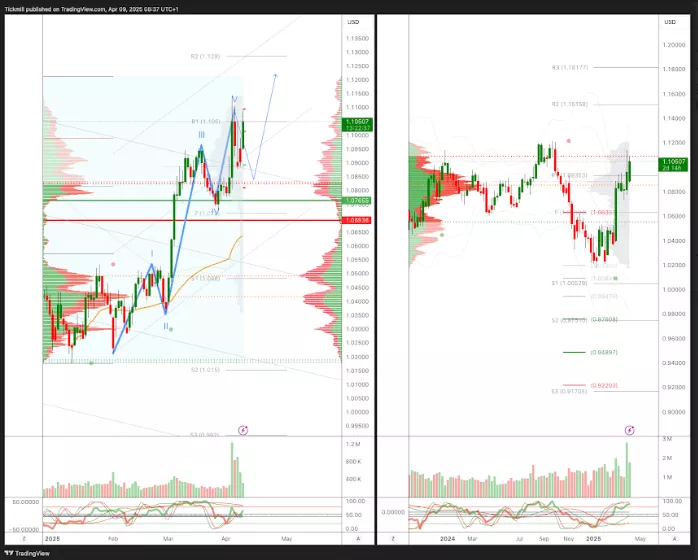
EURUSD Pivot 1.0750
- Daily VWAP bullish
- Weekly VWAP bullish
- Seasonality suggests bearishness into the end of April
- Above 1.0750 target 1.11
- Below 1.0690 target 1.0550
(Click on image to enlarge)
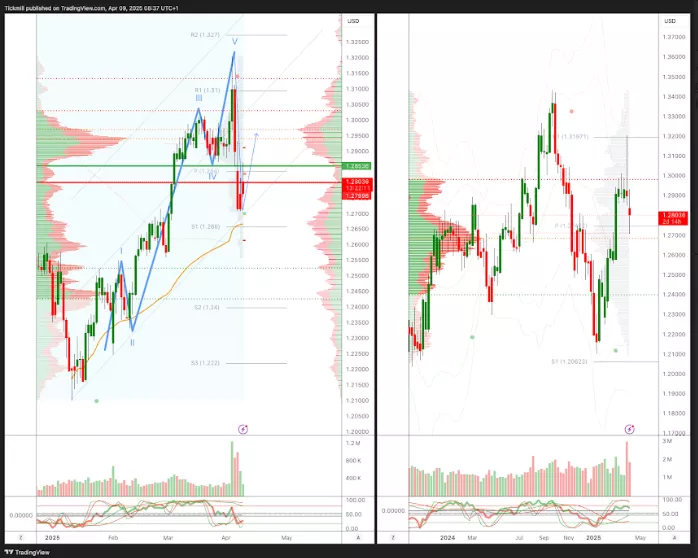
GBPUSD Pivot 1.28
- Daily VWAP bearish
- Weekly VWAP bearish
- Seasonality suggests bullishness into late April
- Above 1.2850 target 1.32
- Below 1.2790 target 1.2660
(Click on image to enlarge)
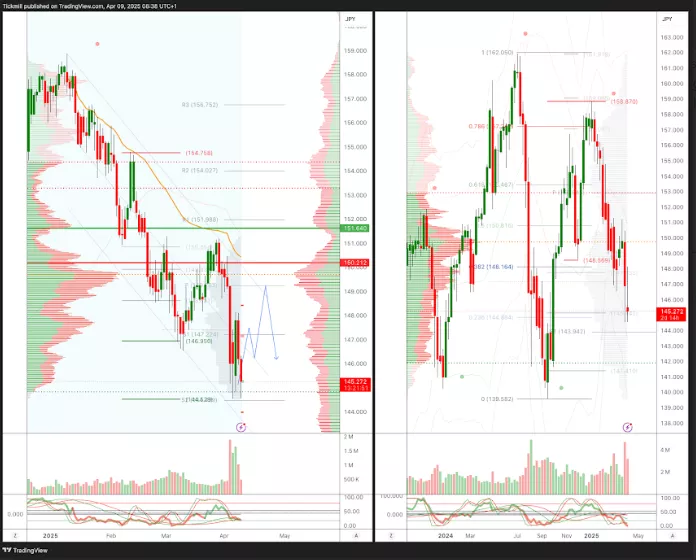
USDJPY Pivot 150.50
- Daily VWAP bearish
- Weekly VWAP bearish
- Seasonality suggests bullishness into Apr 9th
- Above 1.52 target 153.80
- Below 150.50 target 145
(Click on image to enlarge)
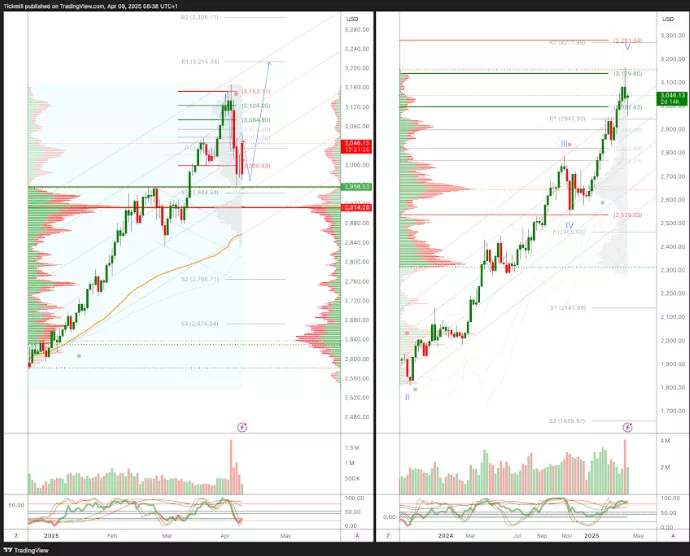
XAUUSD Pivot 2950
- Daily VWAP bearish
- Weekly VWAP bullish
- Seasonality suggests bearishness into mid/late April
- Above 2900 target 3100
- Below 2880 target 2835
(Click on image to enlarge)
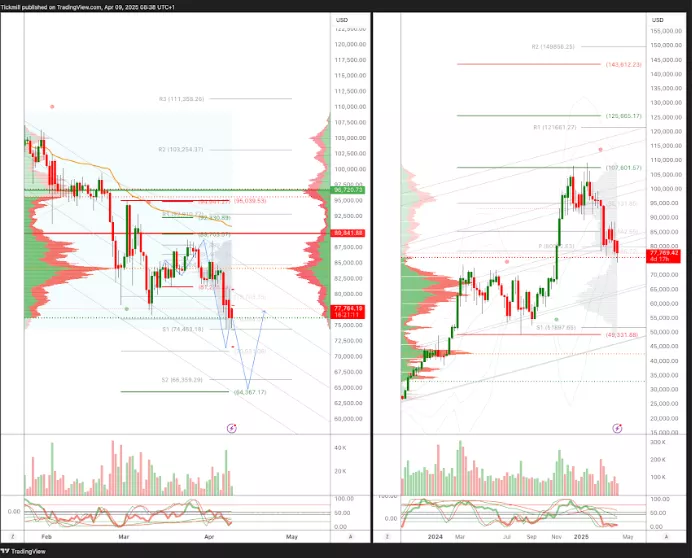
BTCUSD Pivot 90k
- Daily VWAP bearish
- Weekly VWAP bearish
- Seasonality suggests bullishness into Apr 9th
- Above 97k target 105k
- Below 95k target 65k
(Click on image to enlarge)
More By This Author:
The FTSE Finish Line - Tuesday, April 8
Daily Market Outlook - Tuesday, April 8
The FTSE Finish Line - Friday, April 5

Comments
Log in or sign up to join the conversation.