
Daily Market Outlook - Thursday, April 10

Image Source: Pexels
Asian stocks experienced their largest gain in over two years as global financial markets bounced back following Trump's suspension of most of his extensive reciprocal tariffs. Treasuries made a recovery after a turbulent trading session. On Thursday, shares in the Asian region climbed as the S&P 500 enjoyed its best performance since the global financial crisis. While equity-index futures for Europe surged by over 7%, those for US stocks declined, signaling ongoing market instability. Yields on 10-year Treasuries fell after a 34 basis point hike in the past three days raised fears about the condition of the world’s largest debt market. Metals concluded their longest streak of losses in 25 years. Chinese stocks rose amid expectations of further stimulus after Trump increased tariffs on the nation to 125%. Senior officials from the country are set to convene on Thursday to deliberate on new economic strategies. In the wake of global equity markets losing $10 trillion and a dip in US Treasuries, Trump announced a 90-day suspension of the so-called reciprocal tariffs, impacting numerous trading partners after midnight. Nevertheless, he raised tariffs on China to 125%, a move that followed the Asian country’s retaliation by increasing tariffs on US imports to 84%. Oil prices saw another decline as investors adjusted to unexpected policy shifts. Gold prices saw a slight increase.
Base effects are expected to ease US CPI, but the greater concern lies in the price pipeline. While tariff-related worries have influenced inflation expectations across various surveys, the timeline for these concerns to impact actual economic data—if they do at all—remains uncertain. Last month, we saw a slight uptick in goods price inflation, though it wasn’t reflective of tariff changes. This impact is also not expected to significantly appear in the March data. In fact, the median forecast points to a continued decline in headline CPI, with a modest 0.1% month-over-month increase, supported by lower energy prices. This would bring the year-over-year rate down from 2.8% to 2.5%. Core prices are projected to be stronger, but even a 0.3% month-over-month increase would only slightly improve the year-over-year figure, reducing it to 3.0%. Recent improvements in core CPI have been driven by a decline in previously persistent shelter costs. However, this decline has had limited impact on PCE, meaning the anticipated moderation may be less significant. The concern remains that prices could prove stickier than expected. Combined with rising survey price trends and unavoidable cost increases from tariffs, this creates a challenging scenario for the Fed, further complicating already cautious expectations around potential rate cuts. Aside from US CPI, today's data slate includes U8 weekly claims, remarks from BoE's Breeden, and multiple Fed speakers.
Overnight Newswire Updates of Note
- EU Weighs Buying More US Gas Due To Trump Tariff Pressure
- ECB’s Villeroy Salutes Trump’s Step Toward ‘Economic Reason’
- March CPI Seen Cooling, But Trade Tensions Stir US Inflation Risks
- Trump: He’d Use Military to Prevent Iran From Nuclear Weapon
- Johnson Postpone Budget Vote, GOP Seek Concessions On Cuts
- Fed’s Hammack: Markets Are Strained, But Functioning
- Fed Officials Flagged Risks of ‘More Persistent’ Inflation From Tariffs
- Fed Leans Against Inflation and Away From Preemptive Rate Cuts
- GS Issues Then Drops Recession Call As Trump Upends Outlook
- Canada, Mexico Tariffs Are Left Unchanged by Trump Trade Shift
- WTO: Trade Between US, China Could Decrease By As Much As 80%
- China's Deflationary Pressures Persist As Trade Gloom Worsens
- Japan's Wholesale Inflation Accelerates, Signal Sticky Cost Pressure
- Dell Reduces Computer Discounts After Tariffs Rattle Business
- VW Q/Q Results Plunge On Tariffs, EU Carbon Rules, Restructuring
(Sourced from reliable financial news outlets)
FX Options Expiries For 10am New York Cut
(1BLN+ represents larger expiries, more magnetic when trading within daily ATR)
- EUR/USD: 1.0900 (2.4BLN), 1.0910-15 (2BLN), 1.0930-40 (4.3BLN)
- 1.0950 (2.5BLN), 1.0965 (1BLN), 1.1080 (907M), 1.1100 (635M)
- USD/CHF: 0.8350 (460M), 0.8550-60 (370M), 0.8590-0.8605 (480M)
- EUR/GBP: 0.8400-20 (1.5BLN), 0.8490 (360M), 0.8550 (473M), 0.8610 (1.4BLN)
- GBP/USD: 1.2750 (312M), 1.2875 (294M), 1.2900 (201M), 1.2930-40 (508M)
- AUD/USD: 0.6165-70 (1.1BLN), 0.6190-0.6205 (1BLN), 0.6275-85 (1.6BLN)
- NZD/USD: 0.5600-05 (1.2BLN)
- USD/CAD: 1.4040-55 (893M), 1.4070-75 (698M), 1.4215 (584M)
- USD/JPY: 145.00 (780M), 145.20-30 (611M), 145.70-85 (780M), 146.00 (560M)
- 146.55-60 (650M), 147.00-05 (560M), 147.75 (385M), 148.00 (481M)
CFTC Data As Of 4/4/25
- British pound net long position is 34,626 contracts.
- Euro net long position is 51,835 contracts
- Japanese yen net long position is 121,774 contracts
- Bitcoin net long position is 491 contracts
- Swiss franc posts net short position of -42,764 contracts
- Speculators trim CBOT US Treasury bonds futures net short position by 5,627 contracts to 32,648
- Speculators increase CBOT US Ultrabond Treasury futures net short position by 21.663 contracts to 254,029
- Speculators increase CBOT US 2-Year Treasury futures net short position by 44,805 contracts to 1,226,391
- Speculators increase CBOT US 10-Year Treasury futures net short position by 53,173 contracts to 863,263
- Speculators increase CBOT US 5-Year Treasury futures net short position by 121,590 contracts to 2,021,677
- Fund Managers cut S&P 500 CME net long position by 37,007 contracts to 878,833
- Equity Fund Speculators increase S&P 500 CME net short position by 28,330 contracts to 265,197
Technical & Trade Views
SP500 Pivot 5790
- Daily VWAP bullish
- Weekly VWAP bearish
- Seasonality suggests bullishness into late April
- Above 5600 target 5783
- Below 4951 target 4755
(Click on image to enlarge)

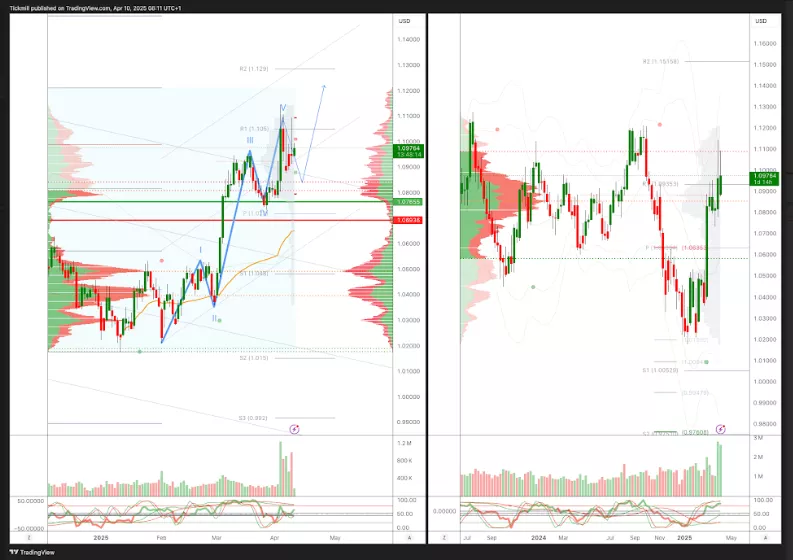
EURUSD Pivot 1.0750
- Daily VWAP bullish
- Weekly VWAP bullish
- Seasonality suggests bearishness into the end of April
- Above 1.0750 target 1.11
- Below 1.0690 target 1.0550
(Click on image to enlarge)
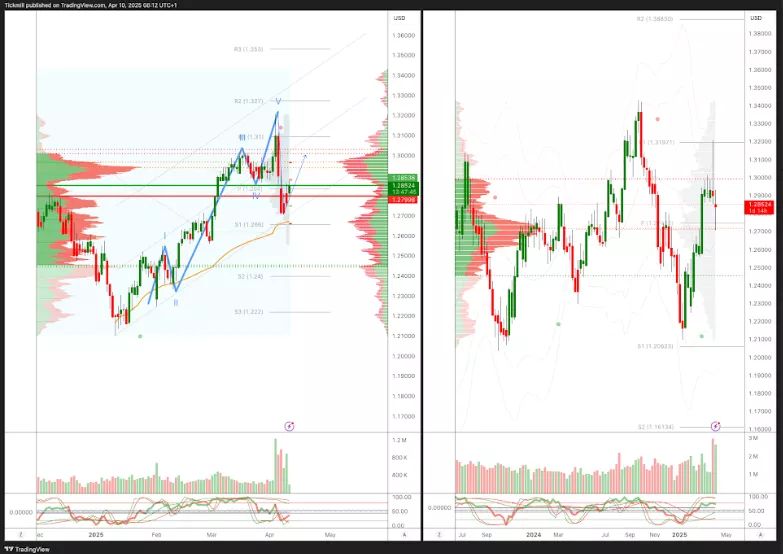
GBPUSD Pivot 1.28
- Daily VWAP bearish
- Weekly VWAP bearish
- Seasonality suggests bullishness into late April
- Above 1.2850 target 1.32
- Below 1.2790 target 1.2660
(Click on image to enlarge)
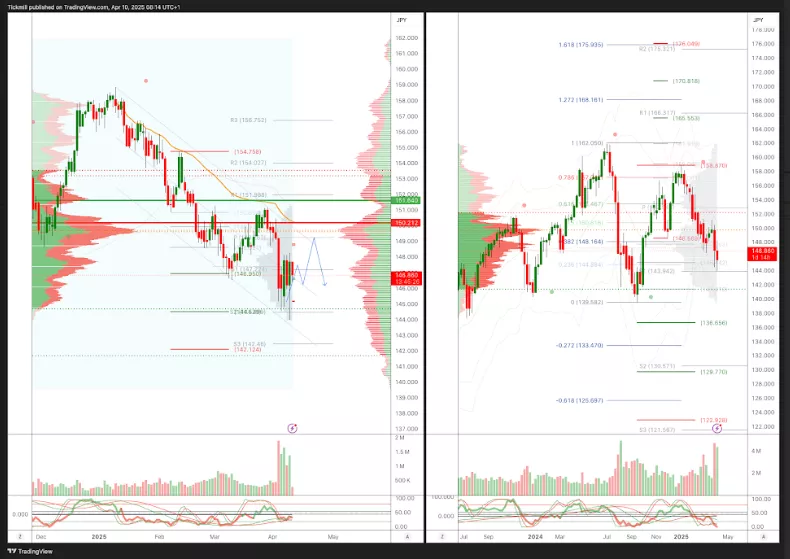
USDJPY Pivot 150.50
- Daily VWAP bearish
- Weekly VWAP bearish
- Seasonality suggests bearishness into early May
- Above 1.52 target 153.80
- Below 150.50 target 145
(Click on image to enlarge)
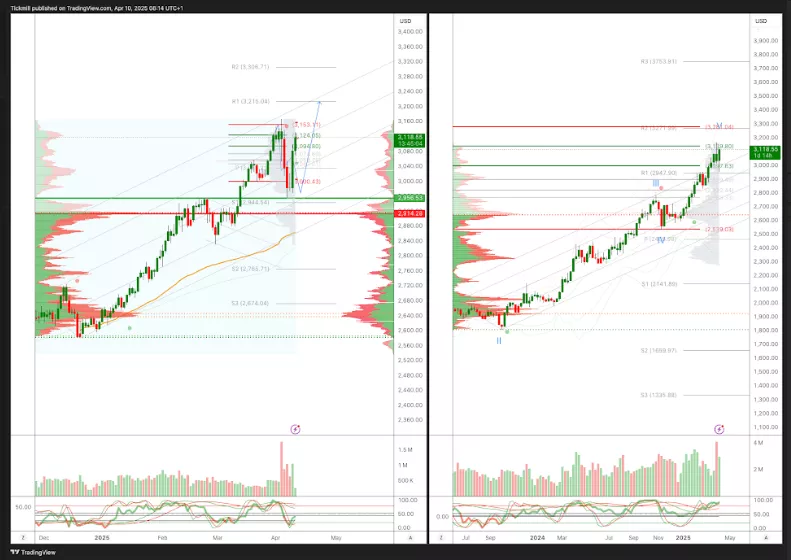
XAUUSD Pivot 2950
- Daily VWAP bearish
- Weekly VWAP bullish
- Seasonality suggests bearishness into mid/late April
- Above 2900 target 3100
- Below 2880 target 2835
(Click on image to enlarge)
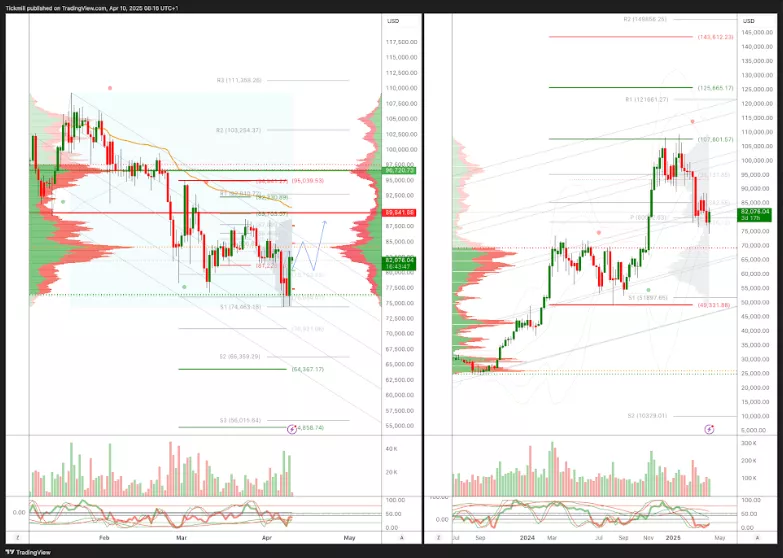
BTCUSD Pivot 90k
- Daily VWAP bearish
- Weekly VWAP bearish
- Seasonality suggests bullishness into mid April
- Above 97k target 105k
- Below 95k target 65k
(Click on image to enlarge)
More By This Author:
The FTSE Finish Line - Wednesday, April 9
Daily Market Outlook - Wednesday, April 9
The FTSE Finish Line - Tuesday, April 8


