
Commitment Of Traders This Week: What Hedge Funds, Futures Are Doing
Following futures positions of non-commercials are as of March 19, 2019.
10-year note: Currently net short 164k, down 12.5k.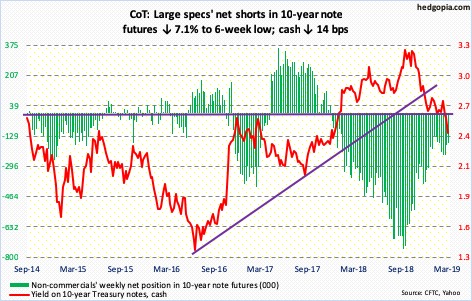
The Fed Wednesday held interest rates steady at 225-250 basis points. This was expected. What was not expected was the dovish turn it took, which was much sharper than markets expected. It now expects no hike this year. Last December, when it last raised, the FOMC dot plot expected two rate increases this year. That was the ninth 25-basis-point increase since the Fed began raising rates in December 2015.
Concurrently, the Fed plans to end the ongoing balance-sheet wind-down in September. It began to run it down in October 2017. Currently, up to $60 billion a month can roll off. As of Wednesday, System Open Market Account (SOMA) holdings stood at $3.76 trillion, down from a peak of $4.24 trillion in April 2017. Prior to three iterations of quantitative easing (QE), these holdings were $500 billion.
The bank expects 2.1 percent growth this year, down from the 2.3 percent it forecast in December. At the same time, it is essentially ending the tightening cycle. The conventional wisdom would argue that this is good for risk-on assets – a la late 2008 and early 2009, when the Fed unleashed its stimulus bazooka, using both conventional and unconventional means. The main difference between now and then is that the US economy is just three months short of completing a decade of recovery/expansion. It is at the top of the cycle, not the bottom. Hindsight is 20/20, but all that QE only brought about a sub-par recovery, during which overall leverage went up not down. Stocks’ – and other assets’ for that matter – reaction function can be different this time around. As the saying goes, fool me once, shame on you; fool me twice, shame on me.
30-year bond: Currently net short 30.2k, up 7.6k.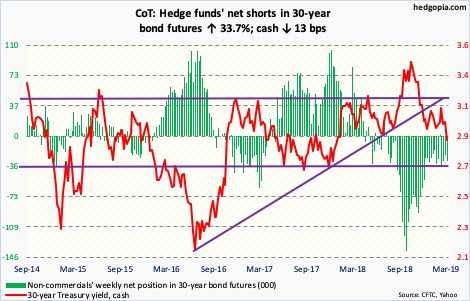
Major economic releases next week are as follows.
Housing starts (February) and the S&P Case-Shiller home price index (January) are due out Tuesday.
Starts shot up 18.6 percent month-over-month in January to a seasonally adjusted annual rate of 1.23 million units. December’s 1.04 million was the lowest since March 2015.
Nationally in December, home prices rose 4.7 percent year-over-year. Price has been decelerating since last March’s 6.5-percent increase.
On Thursday, corporate profits and revised GDP – both for 4Q18 – are on tap.
In 3Q last year, corporate profits with inventory valuation and capital consumption adjustments increased 3.5 percent quarter-over-quarter to $2.32 trillion (SAAR) – a new record.
The initial estimate showed real GDP grew 2.6 percent in the fourth quarter. Growth was 4.2 percent in 2Q and 3.4 percent in 3Q. As of Friday, the Atlanta Fed’s GDPNow model forecasts growth of 1.2 percent in the current quarter.
Friday brings personal income and new home sales – both for February – and the University of Michigan’s consumer sentiment index (March, final).
Personal income fell 0.1 percent m/m in January to $18 trillion. This was the first m/m decline in three years.
In January, new home sales dropped 6.9 percent m/m to 607,000 units (SAAR). The cycle high of 712,000 was reached in November 2017.
Preliminarily in March, consumer sentiment rose four points m/m to 97.8.
Crude oil: Currently net long 529.9k, up 53.2k.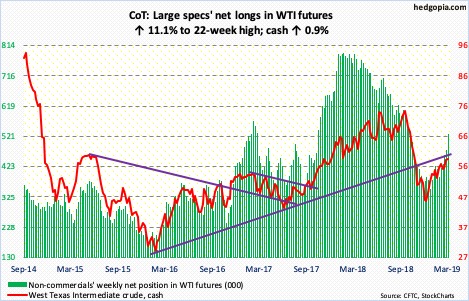
Several times this week, bulls defended last week’s mini-breakout of $58. For several sessions until Friday, the cash ($59.04/barrel) rallied all along the slightly rising daily upper Bollinger band. At the same time, several daily dojis showed up. A breather is due. This week’s high of $60.39 just about tested the underside of a rising trend line from February 2016 when oil bottomed at $26.05. The WTI currently sits between the 50- and 200-day moving averages. If bulls are unable to save $58 near term, horizontal support around $55 is a must-save. The 50-day ($55.24) lies there as well.
The EIA report for the week ended March 15 showed improvement in stocks of crude, gasoline as well as distillates. They respectively fell by 9.6 million barrels, 4.6 million barrels and 4.1 million barrels to 439.5 million barrels, 241.5 million barrels and 132.2 million barrels. Refinery utilization grew by 1.3 percentage points to 88.9 percent. Crude imports, however, rose by 186,000 barrels per day to 6.9 million bpd. Crude production increased by 100,000 bpd to 12.1 mbpd.
E-mini S&P 500: Currently net short 48k, down 18.9k.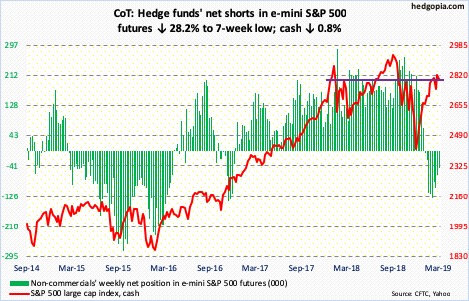
In the week through Wednesday, $47 billion left US money-market funds (courtesy of ICI). This was the highest weekly withdrawal since mid-June last year. Equity bulls obviously hope this is the beginning of a trend. During the October-December rout in stocks last year, these funds gained $168 billion, and then kept gaining even after stocks bottomed post-Christmas. From early October through the high of $3.1 trillion early this month, assets went up by $242 billion. This is potential dry powder for stocks – timing notwithstanding.
In the week to Wednesday, three S&P 500-focused ETFs all saw inflows – SPY (SPDR S&P 500 ETF) $3.5 billion, VOO (Vanguard S&P 500 ETF) $1.7 billion and IVV (iShares core S&P 500 ETF) $2.3 billion (courtesy of ETF.com). In the same week, US-based equity funds took in $3.6 billion (courtesy of Lipper). The only question is if these are Johnny-come-lately’s or more inflows lie ahead.
From late-December lows through Thursday’s intraday high of 2860.31, the cash (2800.71) already rallied nearly 22 percent. Late last week, the S&P 500 slightly rallied past major resistance at 2800-plus but was unable to hang on to it this week. A weekly shooting star showed up this week. The index is tired, even as several divergences have appeared.
Euro: Currently net short 77.7k, up 2k.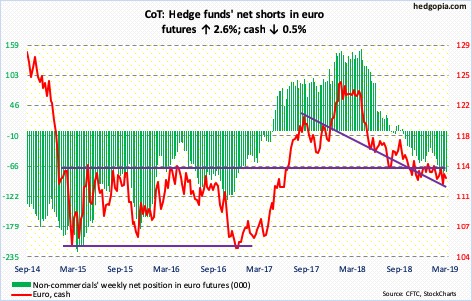
Traders’ post-FOMC reaction Wednesday took the cash ($112.95) to $114.48 intraday, but only to see sellers show up in the next couple of sessions. There is major resistance just north of $115, and that was not even tested. For now, the euro is stuck between that level and $112-$113. Bulls have defended the latter the past four months, including Friday.
Gold: Currently net long 88.4k, up 9.6k.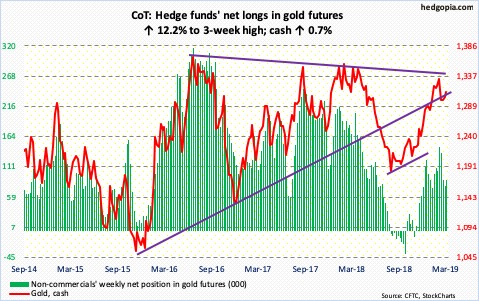
Gold bugs stepped up to defend $1,300 on Monday and Wednesday but were unable to solidly build on it. The cash ($1,312.30/ounce) continues to hover around this level. The 50-day ($1,306.54) lies around there as well.
There are a couple of things that could work in bulls’ favor near term. Since gold bottomed two weeks ago at $1,280.90, it has traded within a slightly rising channel. And, the daily MACD just had a potentially bullish crossover.
In the week to Wednesday, GLD (SPDR gold ETF) took in $246 million. This followed inflows of $245 million in the prior week. IAU (iShares gold trust) lost $26 million in the latest week (courtesy of ETF.com).
Nasdaq 100 index (mini): Currently net long 2.3k, up 15.9k.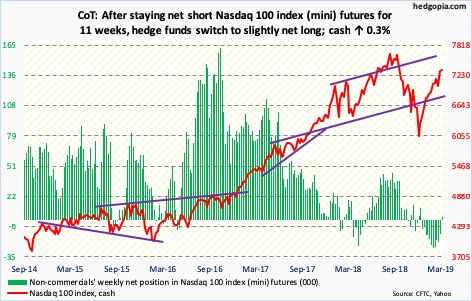
Yet another week of powerful performance by tech bulls in the first four sessions of the week. The cash (7326.06) inched up 0.3 percent in the week; at one time, it was up as much as 2.7 percent. Consequently, a huge gravestone doji showed up on the weekly.
Earlier on Monday, the daily RSI moved into the 70 zone, but only to go back below on Friday. Back in January last year, the RSI persistently remained above 70 for three weeks before the Nasdaq 100 fell apart later that month.
Flows were in cooperation. In the week to Wednesday, QQQ (Invesco QQQ trust) took in $3 billion (courtesy of ETF.com). This was the highest weekly total in a year. Time will tell if this was too little, too late.
Russell 2000 mini-index: Currently net long 9.9k, up 4.4k.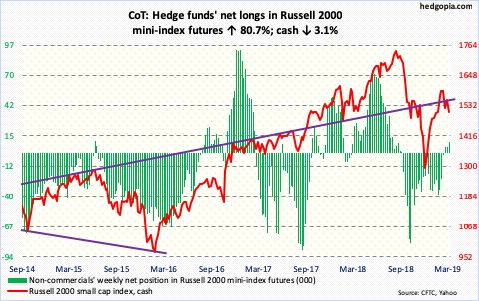
The cash (1505.92) continued to lag its major US peers, even though Thursday’s 1.3-percent rally may have fleetingly reignited bulls’ hopes. The Russell 2000 lost its mojo late February-early this month when it was rejected at 1600-plus. This resistance goes back to January last year. Unlike its major US peers, the index was unable to take out its 200-day. Come Friday, it lost the 50-day as well. Decent support lies at 1450s.
In the week through Wednesday, IJR (iShares core S&P small-cap ETF) attracted $5 million, and IWM (iShares Russell 2000 ETF) $715 million (courtesy of ETF.com).
US Dollar Index: Currently net long 25.9k, down 9.1k.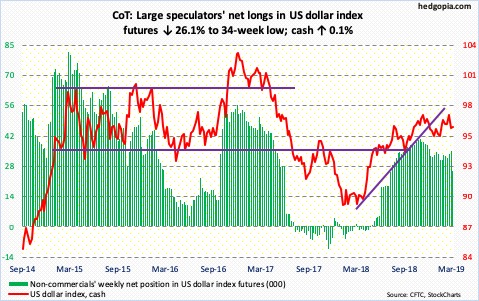
Post-FOMC decision Wednesday, the cash (96.15) fell 0.6 percent to lose the 200-day, closing near the intraday low of 95.17. This was the first loss of that average since last April. Support at 95 goes back at least four years, which dollar bulls were not ready to give up that easy. Come Thursday, the average was retaken, followed by the 50-day on Friday. With a weekly hammer, the daily is itching to move higher.
VIX: Currently net short 128.2k, up 39.2k.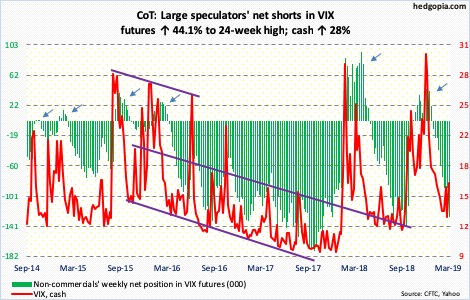
On Monday, the cash (16.48) completed a 50/200 death cross. This indicates the potential for a selloff, although it looks less likely as things stand. Intraday, VIX already dropped from 36.20 on Boxing Day to 12.37 this Tuesday. Even more contraction in volatility will only add fuel to the already overbought fire of US stocks, which then will raise the odds of a flameout.
Investor optimism is elevated. In seven out of the last 10 sessions, the CBOE equity-only put-to-call ratio produced readings of 0.50s. The 10-day moving average ended the week at 0.583. Late September-early October last year, the ratio hovered around this level for several sessions before the bottom fell out of stocks. Around Christmas last year, the ratio reflected plenty of fear, now plenty of greed.


