

Image Source: Pexels
How’s dropping prices for everyday folks going?
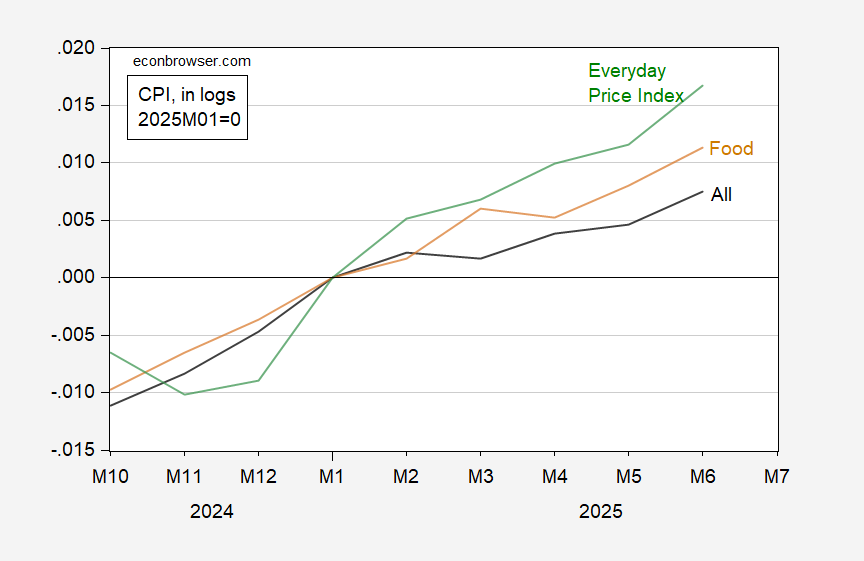
Figure 1: CPI all (black), CPI for food (tan), Everyday Price Index (green), all in logs, 2025M01=0. Source: BLS, AIER, and author’s calculations.
Median household income CPI is not available for 2025. However, over 2024, it tracks the CPI overall (both in nsa terms) very closely. Hence, extrapolating forward, the CPI all should proxy fairly well median income CPI.
As noted in the last post, data collection has declined over the past few years, due to budget constraints. One might hope to access alternative measures would shed light on whether the reported CPI has experienced degradation in accuracy. However, in some instances, alternatives are merely transformations of BLS reported data. For instance, the AIER’s Everyday Price Index (“EPI”) is a weighted average of a subset of CPI categories.
More By This Author:
How Much Longer Can We Trust Our Economic Statistics?Why Trade Uncertainty – Illustrated
“Groceries” Under Trump


Comments
Log in or sign up to join the conversation.