

Photo by Timothy Newman on Unsplash
The US crude oil Western Texas Intermediate collapsed from around daily highs reached during the North American session at $82.35 due to recession fears back in play following the release of soft US economic data. That, alongside hawkish Fed commentary, paired the greenback’s earlier losses, a headwind for oil prices. At the time of typing, WTI trades at $79.08 per barrel.
Wall Street’s finished Wednesday session with losses due to sentiment shifting sour on a gloomy economic outlook in the US. Inflation data at the factory gate, also known as the Producer Price Index (PPI) for December, plunged on its monthly reading, data that could encourage Fed officials to slow down the pace of rate hikes. Retail Sales for the same period shrank by some margin, while Industrial Production dropped.
“Coming on the back of the weakness in retail sales, the steep drop in industrial production and news of more job lay-offs adds to fears the US could already be in recession,” analysts at ING wrote in a note.
Another reason that put a lid on WTI’s rally was the comeback of the greenback. The US Dollar Index (DXY), a gauge of the buck’s value against a basket of six currencies, dropped to an 8-month low but bounced off and erased those losses, exchanging hands at 102.392, almost unchanged.
But what was the reason behind the US Dollar (USD) recovery? Two Fed officials, namely St. Louis Fed President James Bullard and Cleveland’s Loretta Mester, emphasized the need for the US Federal Reserve (Fed) to raise rates above the 5% threshold, with the former stating “as quickly as we can.”
In the meantime, China’s lifting of Covid-19 restrictions should boost oil demand, per the International Energy Agency (IEA)., though Russia’s oil embargo could dent supply.
WTI Technical Analysis
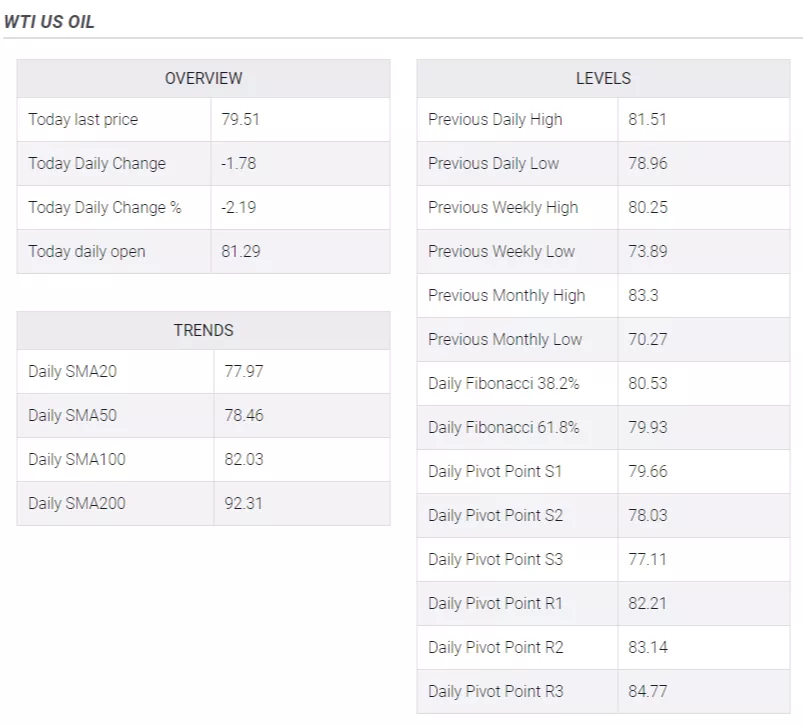
From a daily chart perspective, WTI’s could continue to press upwards, though Wednesday’s high clashed and failed to break above the 100-day Exponential Moving Average (EMA) at $82.87 PB, exacerbating its drop towards $79.00, slightly below the 50-day EMA at 79.17. The Relative Strength Index (RSI), although above the 50 midlines, is accelerating toward its central line, about to cross under, which would open the door to open fresh shorts. WTI key support lie at $79.00, followed by $78.00, and the e0-day EMA at $77.73.
WTI Key Technical Levels
More By This Author:
USD/CAD Hangs Near Daily Low, Just Above Mid-1.3300s Amid Rising Oil Prices/Weaker USD
USD/JPY Holds Steady Below 129.00 Mark, Up A Little Amid Modest USD Strength
Gold Price Forecast: XAU/USD Buyers Take A Breather Around $1910s As The USD Recovers


Comments
Log in or sign up to join the conversation.