WTI Price Analysis: WTI Clears Daily Gains Amid A Weaker USD, OPEC Production Cuts

Image Source: Pixabay
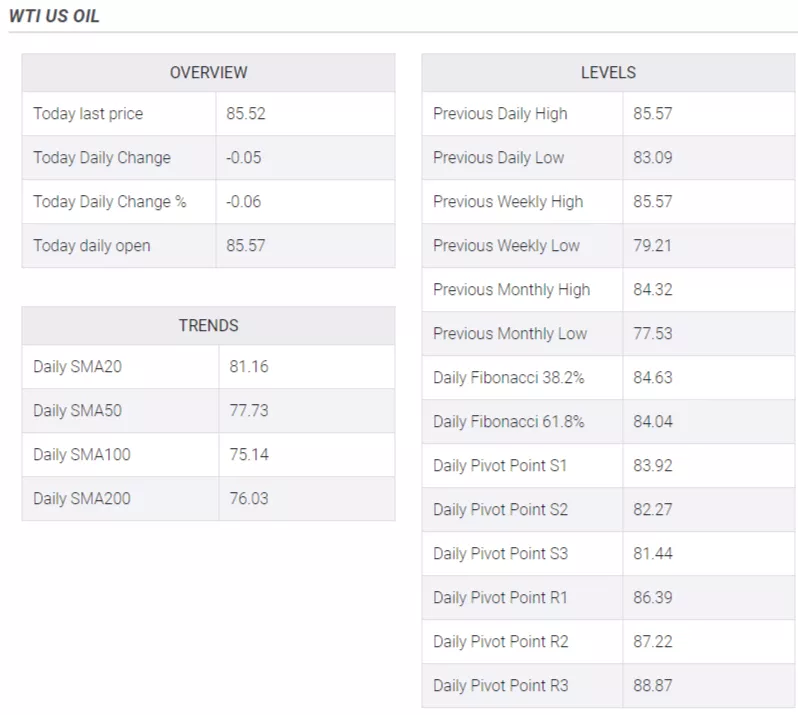
The West Texas Intermediate (WTI) barrel cleared daily losses and traded neutral in the $85.50 - $86.00 zone near multi-month highs, benefited by a softer USD. The Greenback is trading weak against most of its rivals while investors digest Friday’s Nonfarm Payroll (NFP) figures. No relevant economic data will be released during the session, and the focus will shift to Wednesday’s ISM Services PMI figures from August.
NFPs revealed that headline employment grew, but so did the unemployment rate, and wage inflation measured by the Average Hourly Earnings decelerated. Signs of the labour market cooling may ease the pressure on the Federal Reserve (Fed) to continue hiking, and markets started to price in a less aggressive stance for the remainder of the year. As for now, the CME FedWatch tool indicates that the odds of a pause in September remain high while the probabilities of a hike in November and December decreased to nearly 35%, and those dovish bets explain the USD weakness. Interest rates and Oil prices tend to be negatively correlated, so as the Fed approaches the end of its tightening cycle, the WTI may gain further traction.
In addition, the Organization of the Petroleum Exporting Countries (OPEC) and its allies, including Russia, are expected to extend their voluntary production cuts into October, which could contribute to a tighter global supply. Oil prices may get an additional boost.
WTI Levels to watch
Based on the daily chart assessment, a bullish outlook is noted for WTI in the near future. The Relative Strength Index (RSI) resides above its midline in the positive territory near the overbought threshold. It is further validated by the green bars on the Moving Average Convergence Divergence (MACD), indicating a robust bullish momentum. Moreover, the pair is above the 20,100,200-day Simple Moving Average (SMA), pointing towards the prevailing strength of the bulls in the larger context.
Support levels: $85.30, $84.00, $83.00.
Resistance levels: $87.00, $88.00, $89.00
WTI Daily Chart
(Click on image to enlarge)
-638294399089740976.png)

More By This Author:
NZD/USD Pressured Amid Subdued Conditions, Below 0.6000
Natural Gas Takes Step Back In Thin US Holiday Trading
GBP/USD Tanked Below 1.2600 After US NFP And ISM PMIs Data
Disclaimer: Information on these pages contains forward-looking statements that involve risks and uncertainties. Markets and instruments profiled on this page are for informational purposes only ...
more


