
WTI Monthly Win Streak
It’s been a monster year for cruse oil and it continued in April. For the month, WTI rallied 4.4% and finished the month at $104.7 per barrel. This comes as Russian supply has been essentially cut off from Western markets, the Saudis hold back supply, and US drillers are in the process of ramping up capacity to meet demand, which is a process that takes several months to complete. Most notable about April’s rally was that it marked the fifth consecutive month in which WTI rallied, which is tied for the second-longest streak on record (since 1983). The only streak that was longer was in late 2010/early 2011 when WTI notched eight straight months of gains.

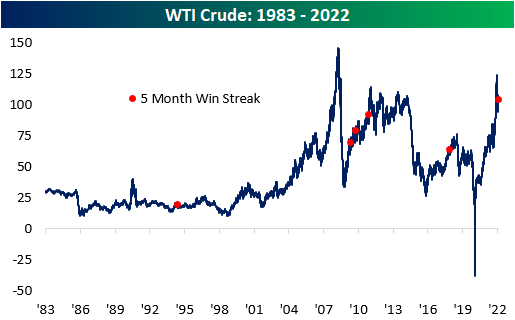
The chart below outlines the long-term price chart of WTI Crude. Two aspects stand out in the chart. First, crude oil tended to see additional gains in the short term following these five-month streaks. Secondly, it is also worth noting that three of these occurrences happened within two years (2009 – 2011), which was likely due to aggregate demand ticking higher as the economy emerged from the Global Financial Crisis. The current period is relatively similar, as the global reopening has put upward pressure on the demand curve after oil producers lowered output during COVID. That increased demand has also been exacerbated by supply constraints following the Russian invasion of Ukraine.
The table below outlines the performance of WTI after the fifth straight month of prior five-month win streaks. WTI tended to trade down over the following month but reversed course to book gains in the following three and six months. In the month following these streaks, WTI averaged a loss of 4.4% (median: -4.8%), booking gains just one time (20%). After three months, WTI averaged a gain of 5.1% (median: 5.5%), performing positively 80% of the time. Over the next six months, average performance and positivity rates declined to 1.9% and 60%, respectively.
Higher oil prices affect energy prices, shipping rates, and the cost of so many more secondary products. Therefore, higher oil prices tend to be inflationary and crimp corporate margins as well as consumer buying power. Historically speaking, though, the S&P 500 has averaged a gain of 8.3% (median: 12.1%) during these streaks, which is 420 basis points higher than the average performance for all five-month periods since 1983. In the month following these streaks, the S&P 500 has averaged a gain of 1.4% (median: 3.2%), which is higher than the historical average as well. In the next three months, the index has averaged a gain of 4.5% (median: 4.9%) with positivity rates higher than that of all periods. Similar to what we see in the six-month performance of WTI, positivity rates moderate for the S&P 500, with average six-month gains of 3.2% (median: 0.2%) versus around 5% for all six-month periods since 1983.

Disclaimer: Bespoke Investment Group, LLC believes all information contained in this report to be accurate, but we do not guarantee its accuracy. None of the information in this report or any ...
more

