
Oil prices were weaker in mid-day trade on Wall Street after the United States reported inflation last month rose at an annualized 6% pace, matching expectations and down from 6.4% in January.
However, inflation is still way above the Federal Reserve's targets which imply prospects of a recession, especially amid the banking sector concerns that continue to challenge growth and demand-dependent commodities such as oil.
West Texas Intermediate crude oil is down by over 3% on the day now and printing fresh session lows in New York at the time of writing.
Looking to the charts, we can apply a multi-timeframe analysis to determine prospects of a correction in the meanwhile but ultimately, a bearish bias prevails as follows:
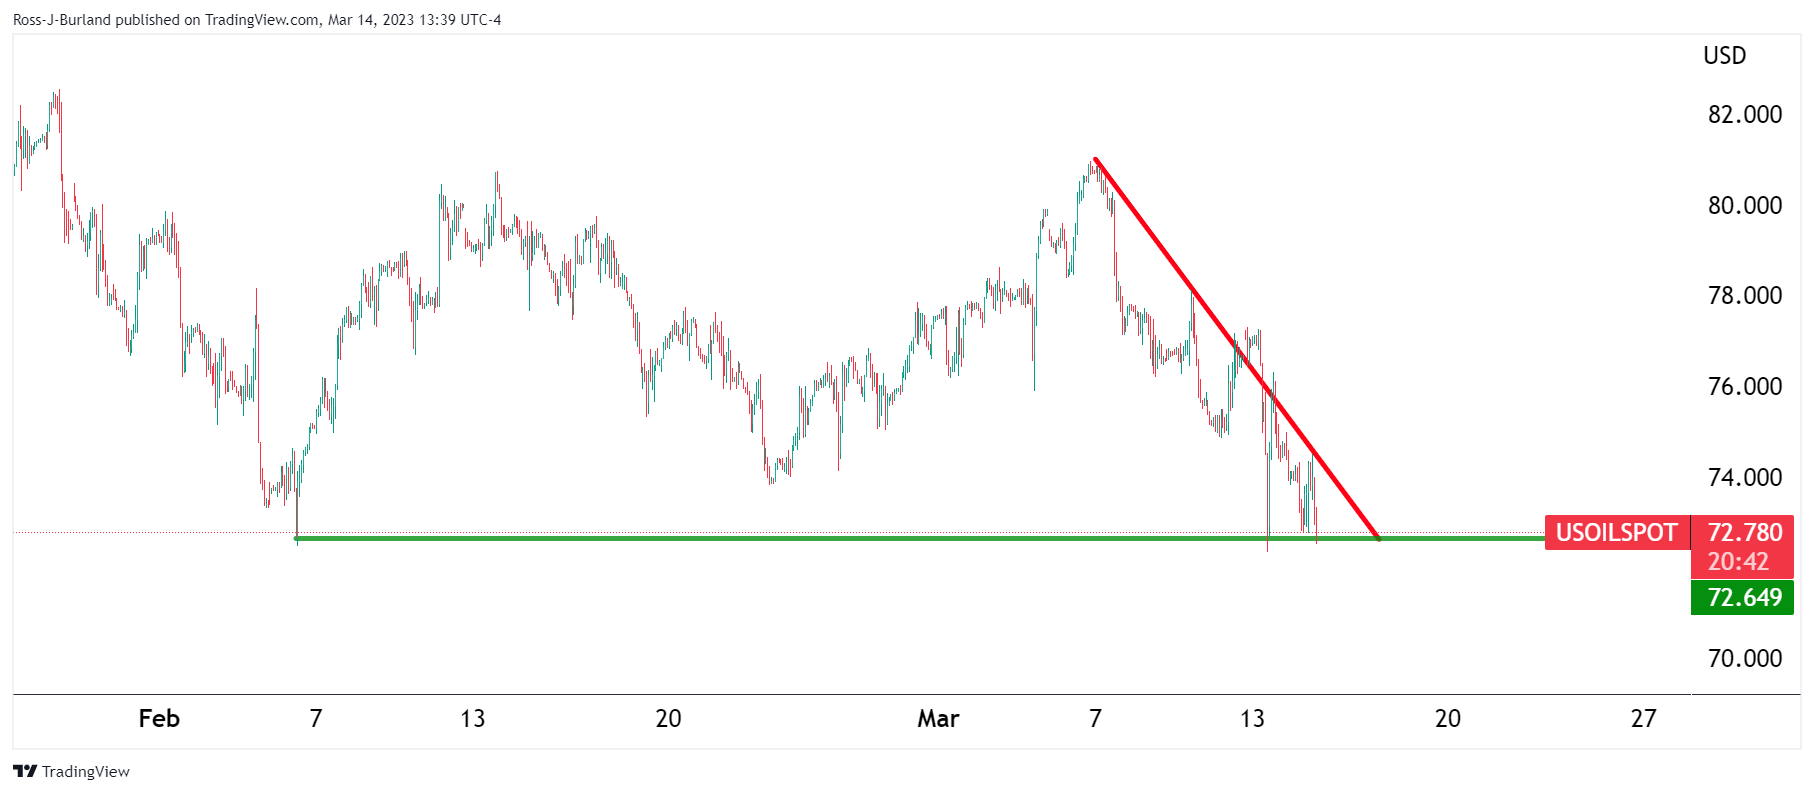
WTI daily charts
(Click on image to enlarge)
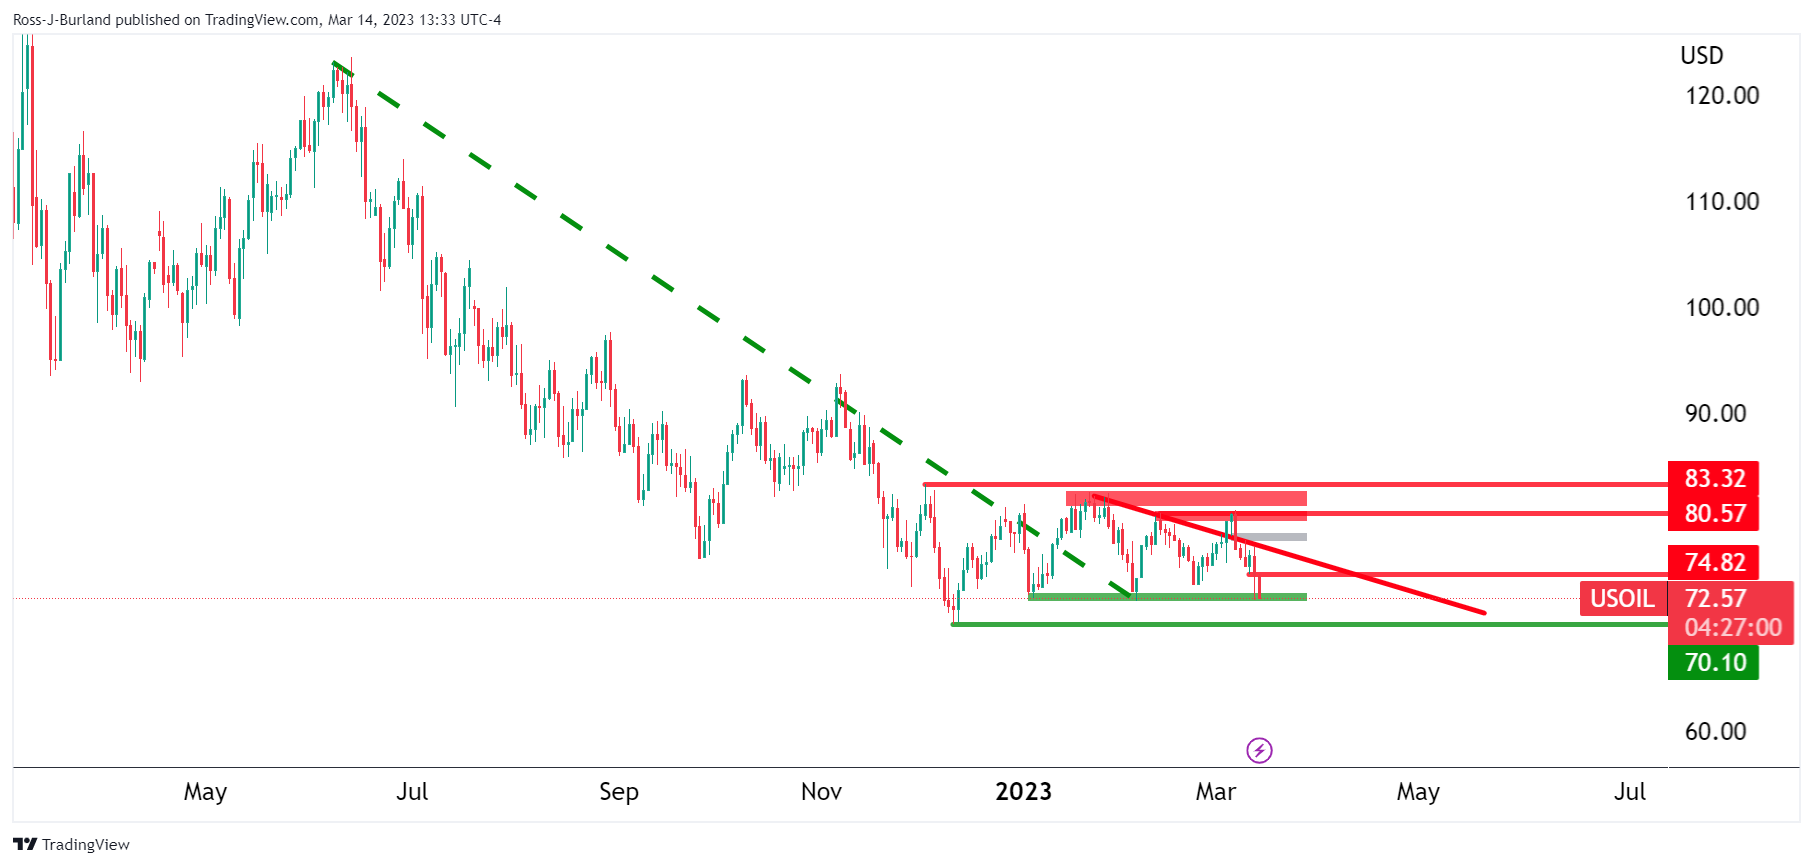
In a series of lower highs, the daily charts show the price moving sideways within a broad range of between $70.10 and $83.32. There is a price imbalance, greyed area, above $77.50, but the momentum is with the bears while below $74.80, and liquidity below $70.10 is calling. However, while being on the backside of the bearish trend, (broken bear trendline), this could be a phase of accumulation and a clear out of stale stops below $70.10 could result in a surge of demand further down the line. nonetheless, the bears are in control for the time being
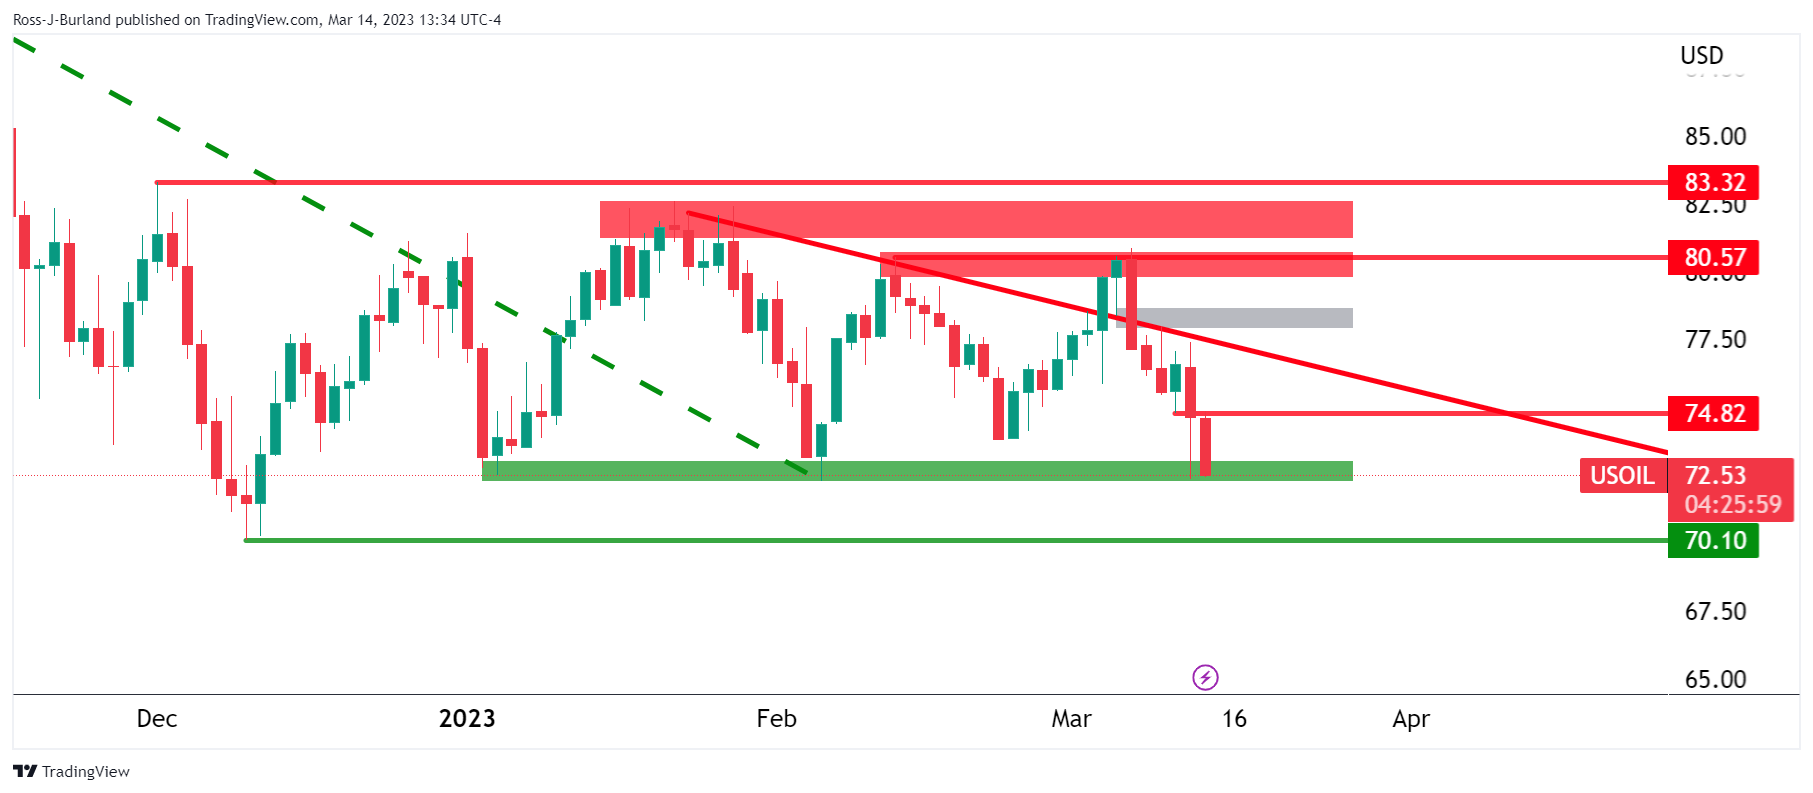
WTI weekly charts
(Click on image to enlarge)
The weekly charts show that the price broke the bullish trend and is now backside and moving sideways but still biased lower while on the front side of the micro bear trendline below $74.82 as illustrated above.
However, the M-formation could hamstring the bears between $70.25 and the neckline near a 50% mean reversion of $76.70.
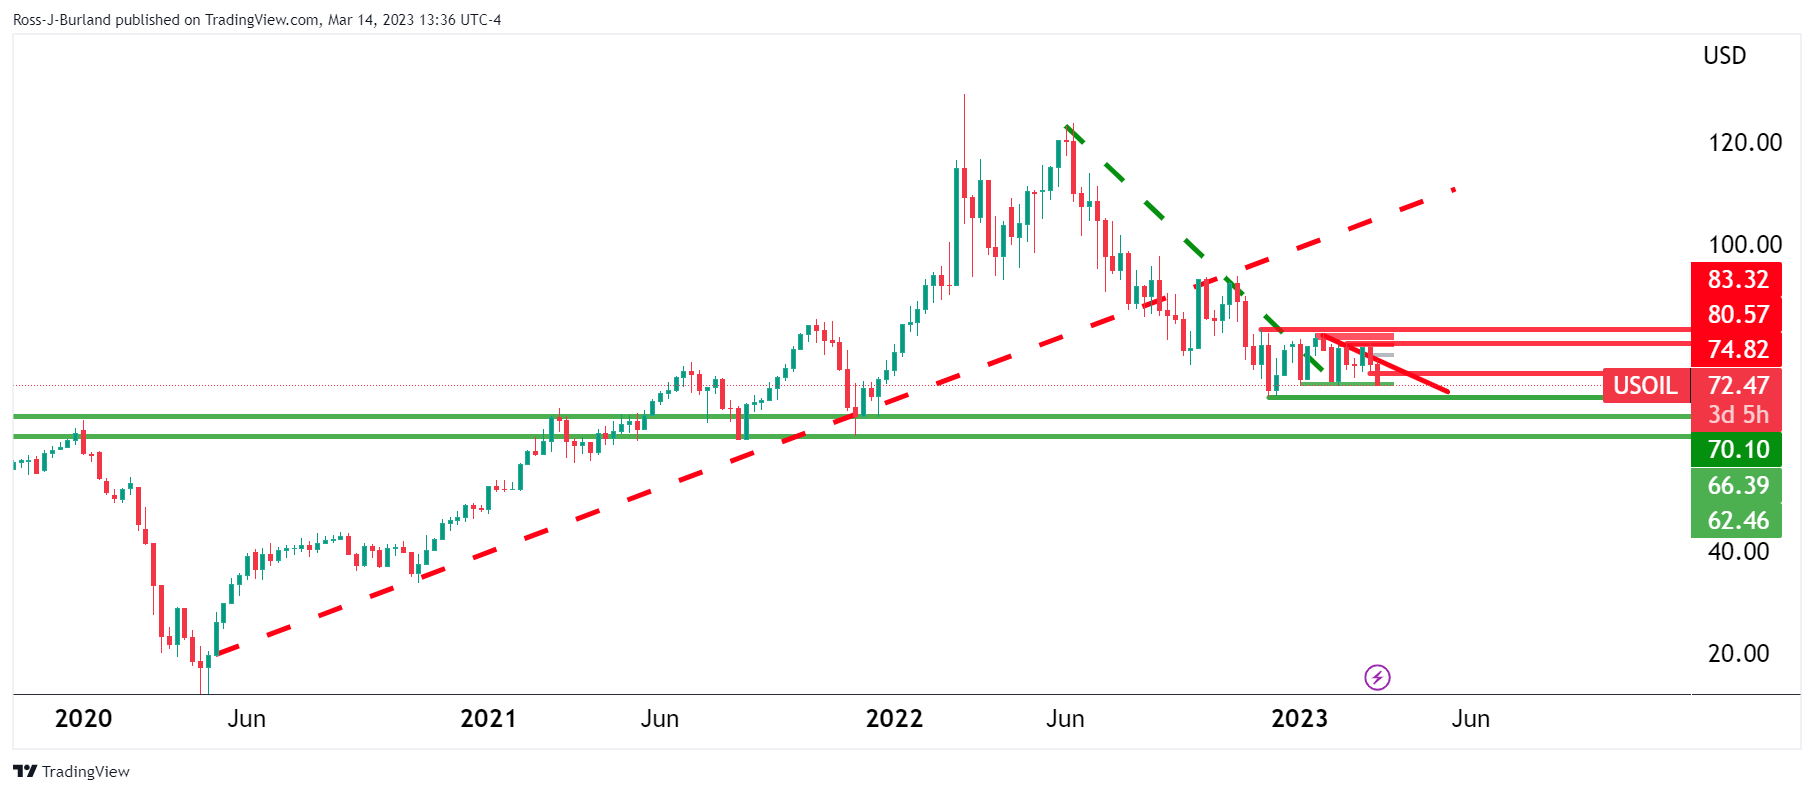
WTI H1 charts
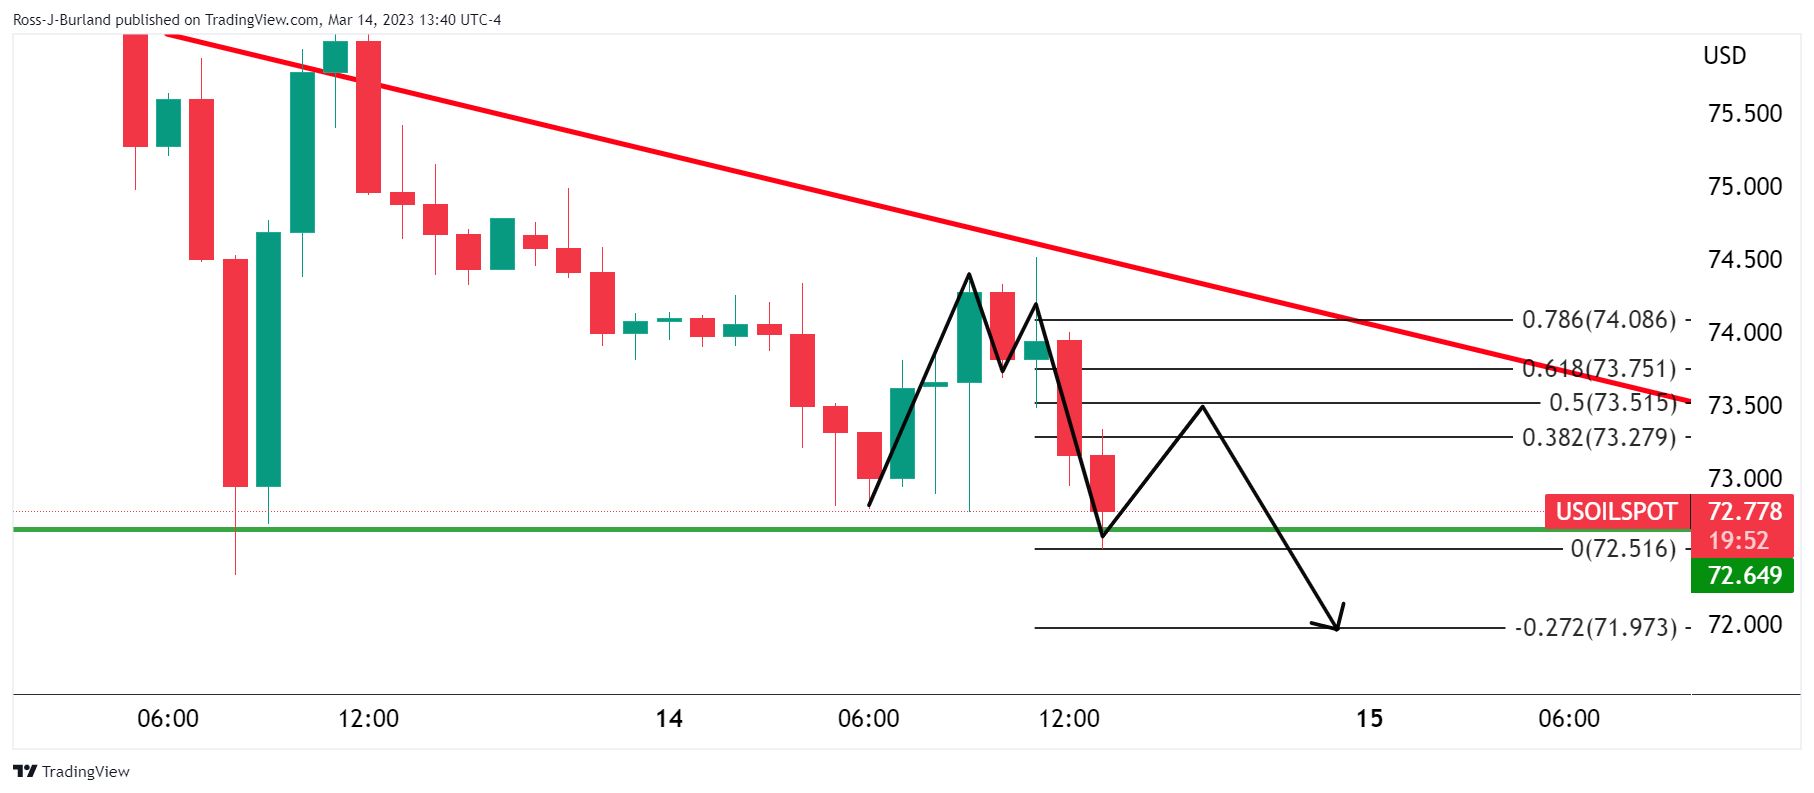
Moving down to the hourly chart, we see that the price is indeed on the front side of the bear trendline but meeting support. The M-formation, zooming in, is a reversion pattern that could see a correction in the forthcoming hours from support before a downside continuation to test $72 the figure.
More By This Author:
Silver Price Analysis: XAG/USD Faces The 200-DMA At Around $21.70s
Canada: Job Numbers Offer Plenty Of Reason For The BoC To Leave The Door Open To Future Rate Hikes – CIBC
EUR/USD Climbs On High Inflation Data In Germany, As US Dollar Sinks Post US NFP


Comments
Log in or sign up to join the conversation.