Silver Price Analysis: XAG/USD Faces The 200-DMA At Around $21.70s
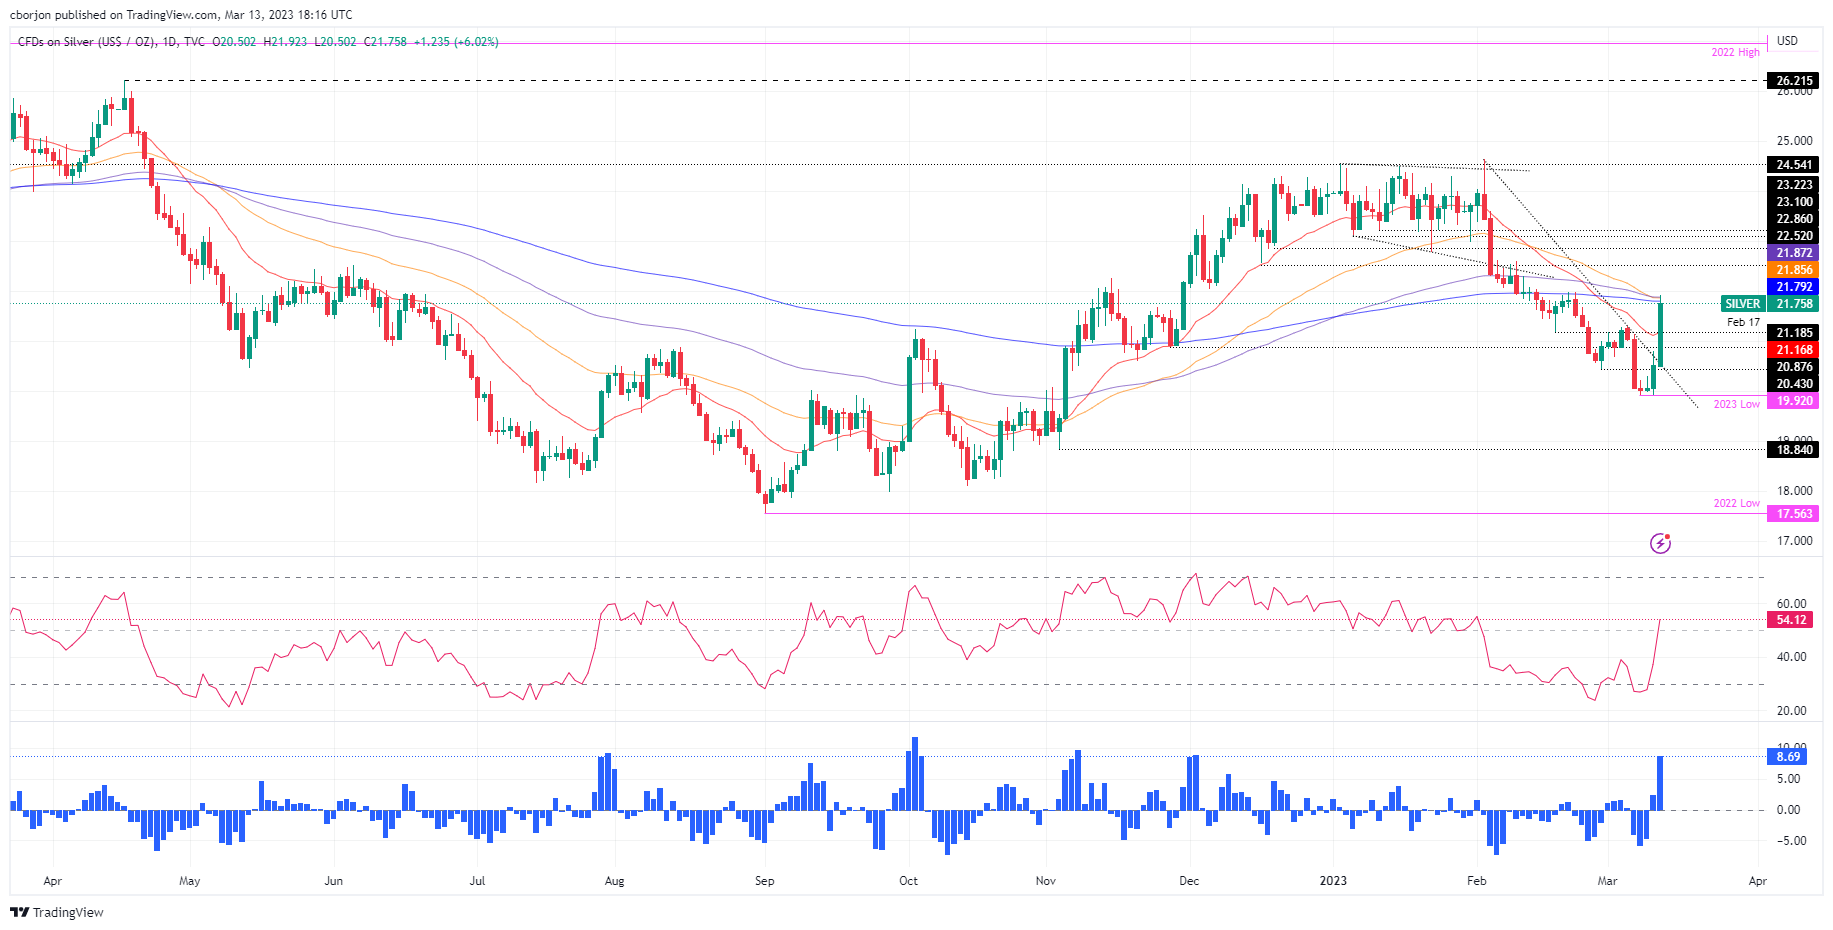
XAG/USD surges sharply in Monday’s session, up by more than 6% on investors flying to safety. US Treasury bond yields collapsed due to regional bank failure in the United States (US) blamed on higher rates. Therefore, US bond yields collapsing are a tailwind for the white metal prices. At the time of writing, the XAG/USD is trading at $21.76.
XAG/USD Price Action
The white metal is testing solid resistance in the confluence of the 200, 50, and 100-day Exponential Moving Averages (EMAs), each at $21.79, $21.85, and $21.87, respectively. In addition, the Relative Strength Index (RSI) broke above the 50 neutral lines, portraying buying pressure strength. The Rate of Change (RoC) suggests buyers moved aggressively, which could open the door for a mean reversion move. Therefore, traders should be careful.
With XAG/USD breaking above the 200-day EMA would pave the way toward $22.00 a troy ounce. Once done, the XAG/USD next resistance would be $23.00 before testing the February 23 high at $23.59.
In an alternate scenario, the XAG/USD first support would be the 20-day EMA at $21.16. A breach of the latter will expose the $21.00 figure, followed by the March 13 low of $20.50, before falling to YTD lows at $19.92.
XAG/USD Daily Chart
(Click on image to enlarge)

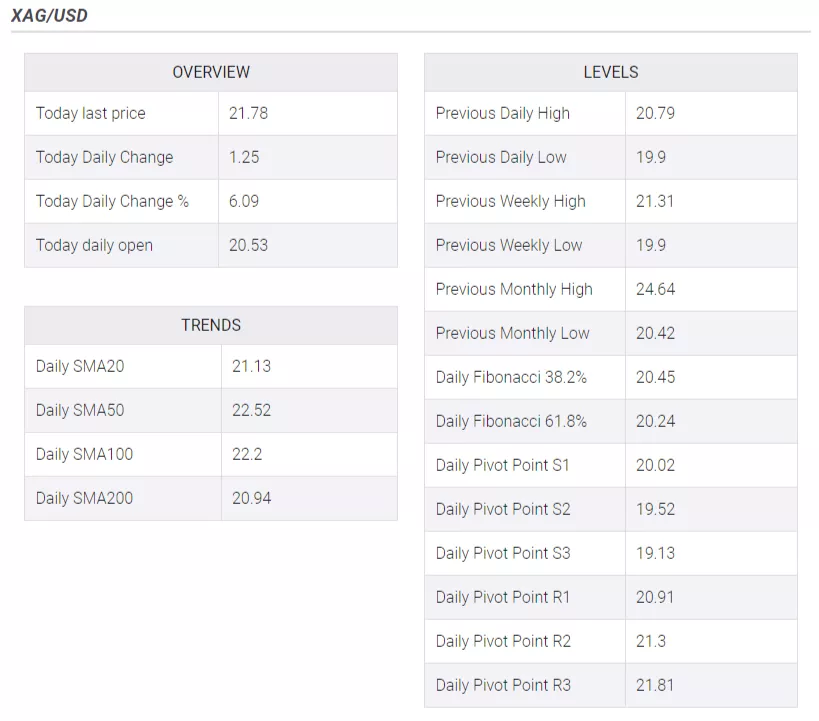
XAG/USD Technical Levels

More By This Author:
Canada: Job Numbers Offer Plenty Of Reason For The BoC To Leave The Door Open To Future Rate Hikes – CIBC
EUR/USD Climbs On High Inflation Data In Germany, As US Dollar Sinks Post US NFP
Gold Price Forecast: XAU/USD Bulls Stay Involved Despite Weak Close On Wall Street
Disclaimer: Information on these pages contains forward-looking statements that involve risks and uncertainties. Markets and instruments profiled on this page are for informational purposes only ...
more


