
Where Next For Gold – Will It Regroup And Try Again?
Following last week’s volatility which spanned the markets with the sell everything mentality time to check in on gold and in particular the daily chart to get a handle on where the precious metal is heading longer term.
(Click on image to enlarge)
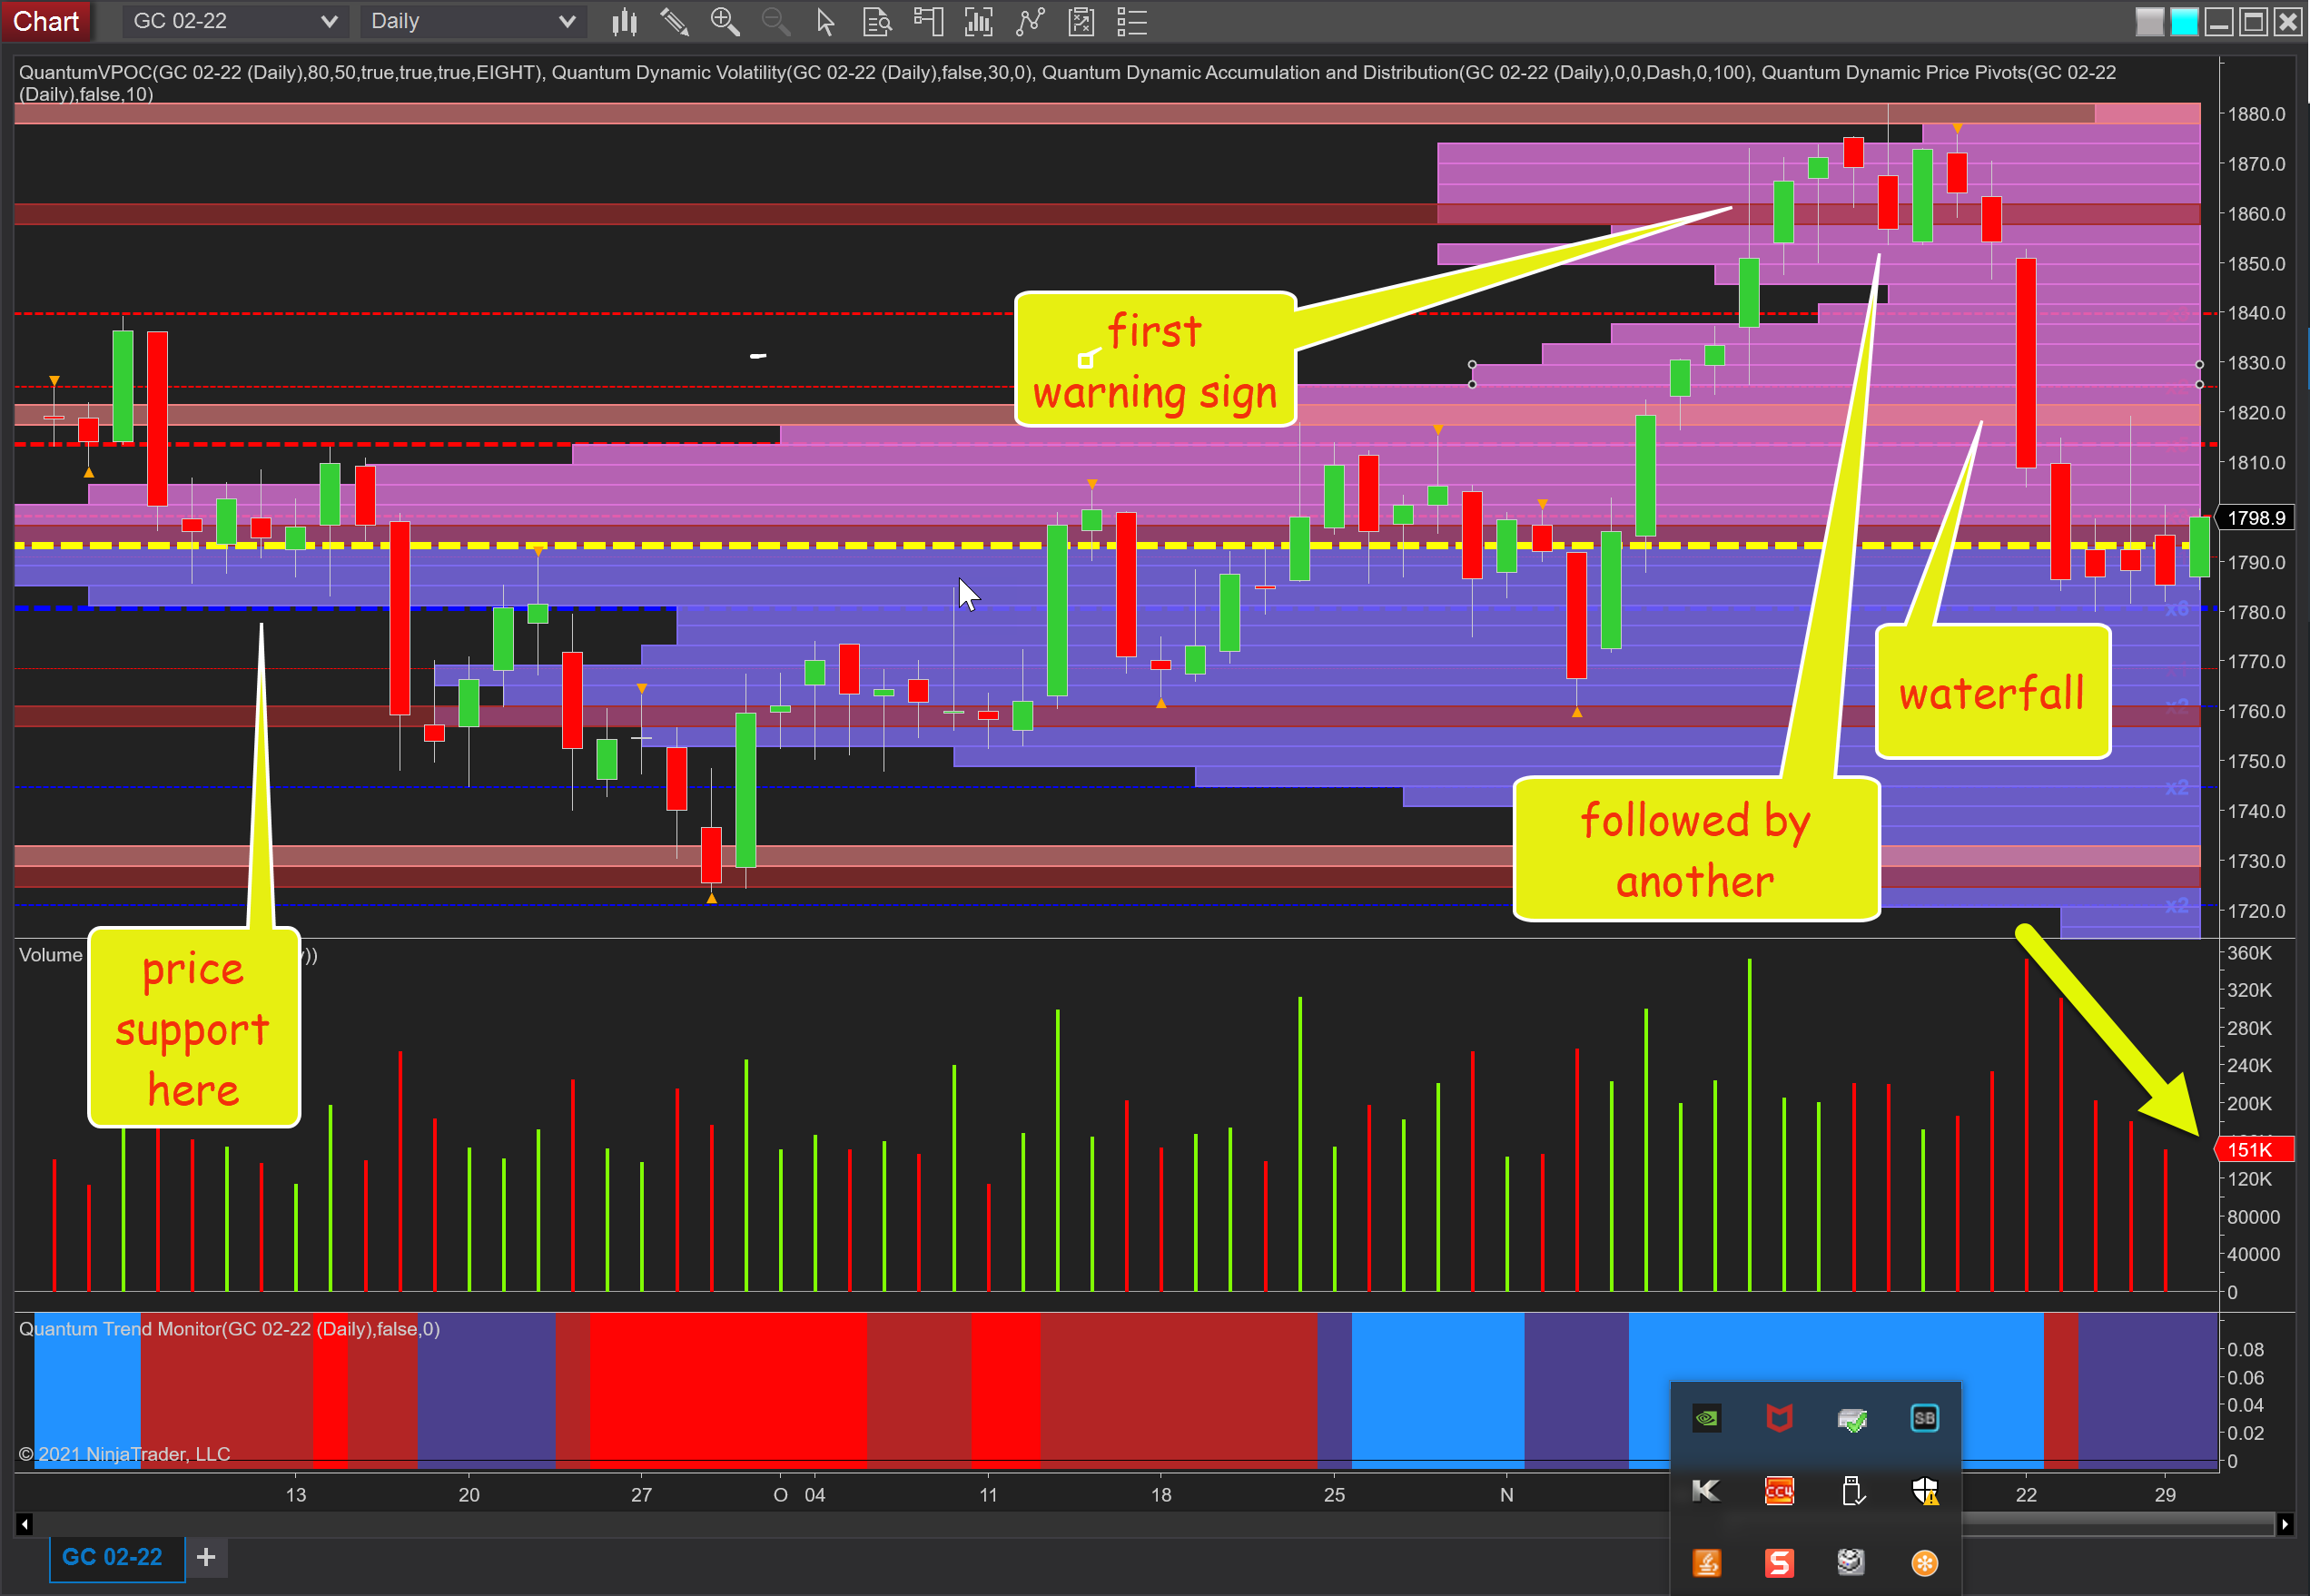
If we step back for a moment and consider the price action from a volume perspective, it was the price action of the 10th of November which was not a good omen despite the breach of the significant resistance level at $1840 per ounce. This was the level we have been waiting on for some time, but the candle posted closed with a deep wick to the upper body on high volume and an ominous portent of things to come with the wick signaling a resistance to higher prices and selling by the big operators into weakness. While the metal did manage to continue higher for a couple of days thereafter, touching a high of $1882 per ounce on the 16th, this was to be the zenith for gold, with the price action closing on the day with further weakness and a second deep wicked candle. The price waterfall duly developed from the 18th of November on widening spreads and rising volume, before the metal arrived back at the volume point of control at $1795 per ounce and some much-needed respite. For gold bugs, this should offer a cushion to further falls, also confirmed by the dramatic decline in volume under the down candles of the last few days, suggesting selling pressure has wained.
In the short term, we can expect to see a further period of congestion around the $1800 per ounce area, supported by the strong platform of price-based support below and denoted with the blue dashed line of the accumulation and distribution indicator at $1780 per ounce. So two strong platforms of support in place with the VPOC and the ACD indicator. So what are we looking at in terms of a bullish recovery? And the short answer is a trend higher which is more considered and less volatile on steadily rising volume which was not what we witnessed last time.
The barriers ahead are at $1811 per ounce with the red dashed line which is a well-developed region, but once past $1820 per ounce we move into a low volume region on the VPOC histogram, which increases from $1850 per ounce to $1870 per ounce before falling again. But in general, not a deep area so a positive outlook longer term. Short term, congestion expected, medium term a recovery and retest of the $1840 per ounce area, assuming volume is supportive.
Disclaimer: Futures, stocks, and spot currency trading have large potential rewards, but also large potential risk. You must be aware of the risks and be willing to accept them in order to invest in ...
more

