
Wheat - Elliott Wave Technical Analysis
Wheat Elliott Wave Analysis
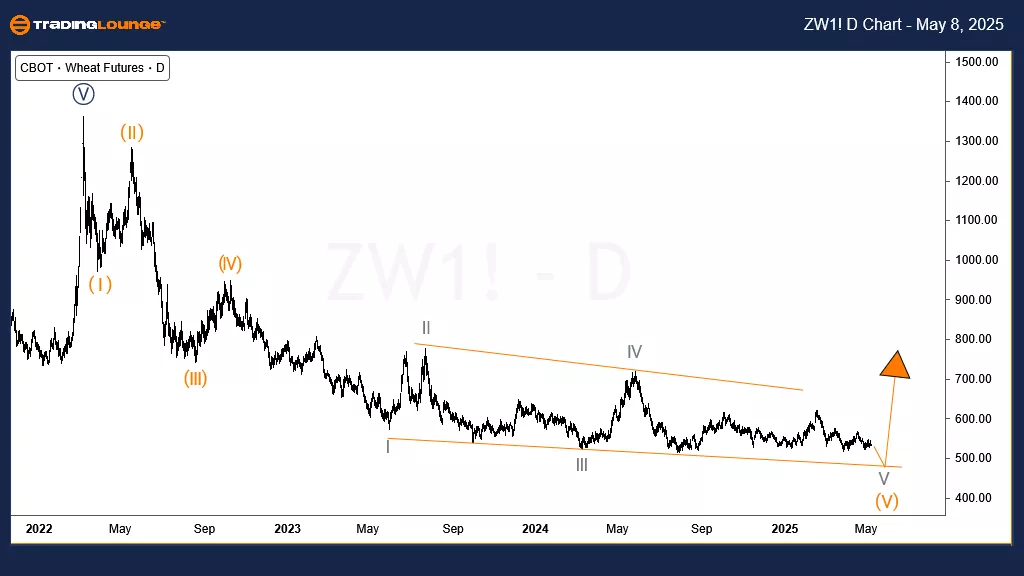
Wheat prices continue to face downward pressure, with sellers targeting the $500 mark in the short to medium term. The commodity has been locked in a bearish market cycle since March 2022. However, Elliott Wave analysis indicates that a significant corrective bounce could soon occur to counter the entire bearish cycle. Still, a break below the $510 support level toward $500 or lower might happen before the recovery begins.
Wheat Elliott Wave Analysis – Daily Chart
The daily chart shows that the bearish cycle starting from March 2022 is nearing completion. This decline has followed a 5-wave impulse structure from that peak. The fifth wave, labeled wave (V), seems close to completing an ending diagonal pattern. This setup suggests that sellers should become cautious and less aggressive. Currently, price action sits within wave V of (V), expected to be the final push downward. Within wave V, waves ((A)) and ((B)) have already completed, and wave ((C)) is developing, possibly around its midpoint.
Wheat Elliott Wave Analysis – H4 Chart
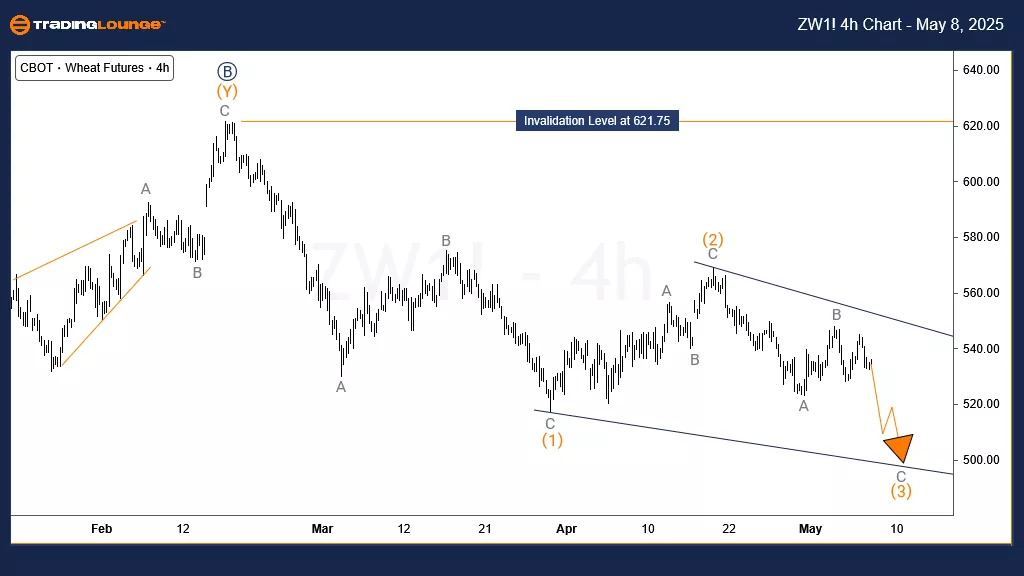
On the 4-hour chart, analysis suggests that wave ((C)) of V could form an ending diagonal, finalizing a larger 5-3-5 zigzag structure from the May 2024 peak. Price action will need to confirm if it completes this proposed diagonal for ((C)). If so, the decline since April 2025 could be considered wave (3) of ((C)), which holds the potential to hit the $500 target shortly. Short-term sellers may continue to find opportunities from price bounces. However, long-term sellers should exercise caution, as the prolonged bearish phase could soon conclude.
Technical Analyst: Sanmi Adeagbo
More By This Author:
Elliott Wave Technical Forecast: Block, Inc. - Thursday, May 8
Elliott Wave Technical Analysis: Qualcomm Inc. - Thursday, May 8
Elliott Wave Technical Analysis: U.S. Dollar/Japanese Yen - Thursday, May 8
At TradingLounge™, we provide actionable Elliott Wave analysis across over 200 markets. Access live chat rooms, advanced AI & algorithmic charting tools, and curated trade ...
more

