
Wheat Elliott Wave Technical Analysis
Wheat Elliott Wave Analysis
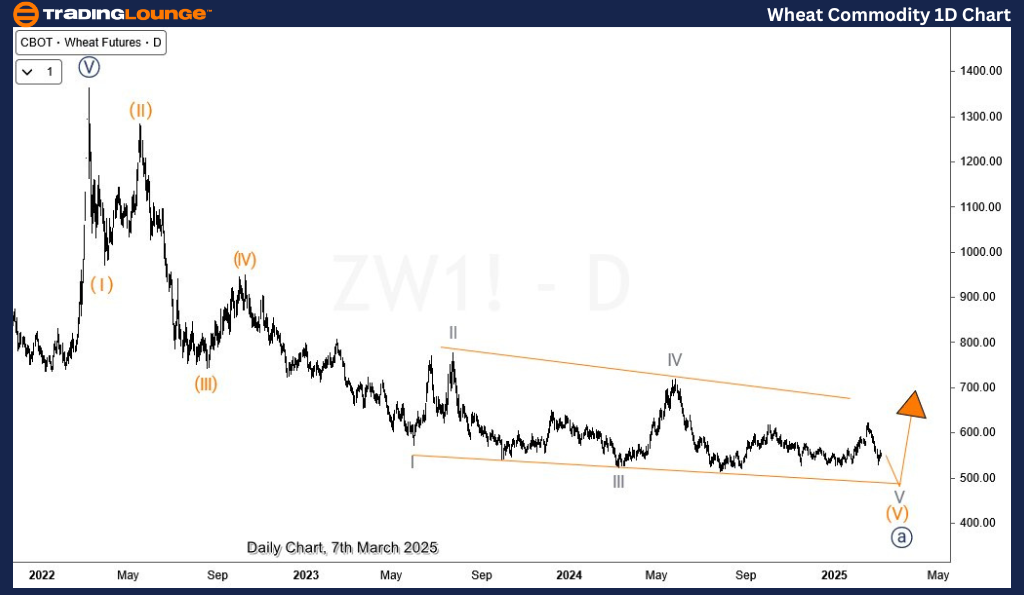
Wheat is close to completing a long-term bearish impulse wave from March 2022, which may soon be followed by a multi-week or multi-month corrective bounce. In the short term, this bearish phase resumed from the February high after a nearly seven-week rebound from late July 2024.
Wheat Daily Chart Analysis
On the daily chart, wheat is completing a bearish impulse from the top of March 2022. The 5th wave - wave (V) is extended as it emerges as an ending diagonal structure from October 2022. Meanwhile, the ending diagonal structure is close to concluding wave V of (V) which will most likely extend to $500 or below.
Wheat H4 Chart Analysis
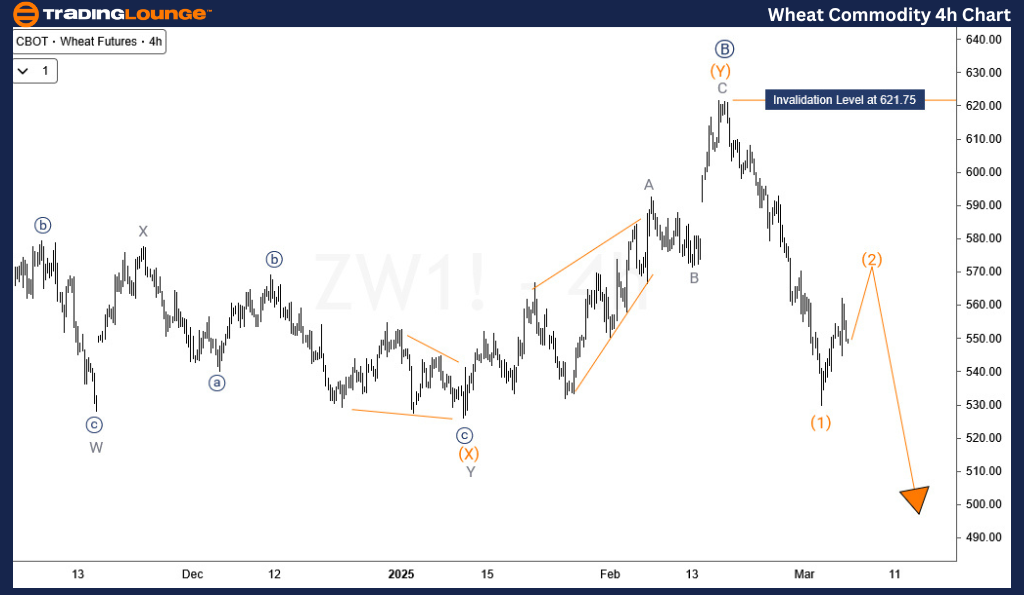
Price finished waves ((A)) and ((B)) of V in July 2024 and February 2025 respectively. From February 2025, wave ((C)) of V emerges lower. After completing a 5-wave down for wave (1), the commodity is now rebounding in wave (2) of ((C)). Thus, while 621.75 is not breached, the short-term path is to the downside of $500 or below. However, traders should beware of the price action around 500 as a large bullish corrective phase may start around there.
Technical Analyst : Sanmi Adeagbo
More By This Author:
Unlocking ASX Trading Success: James Hardie Industries
Elliott Wave Technical Analysis: British Pound/Australian Dollar - Friday, March 7
Elliott Wave Technical Analysis: Bitcoin Crypto Price - Friday, March 7
At TradingLounge™, we provide actionable Elliott Wave analysis across over 200 markets. Access live chat rooms, advanced AI & algorithmic charting tools, and curated trade ...
more

