
Remember when Trump was elected as the U.S. President? And remember what happened to the price of gold at that time?
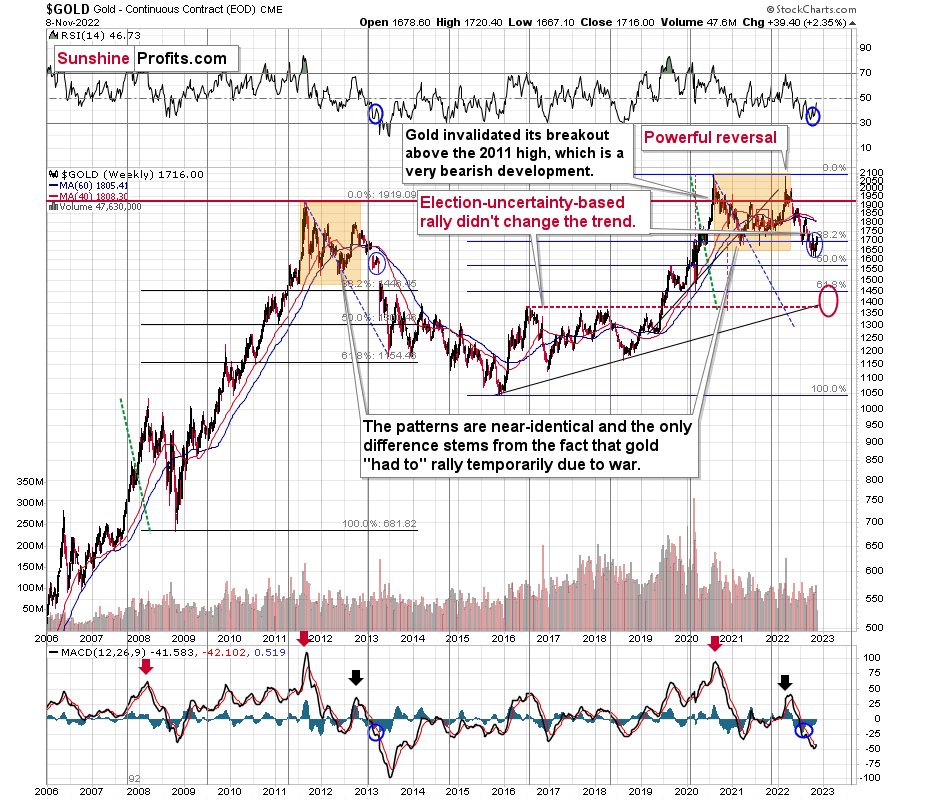
I marked in on the above chart, but to make it clearer, I’ll zoom in.
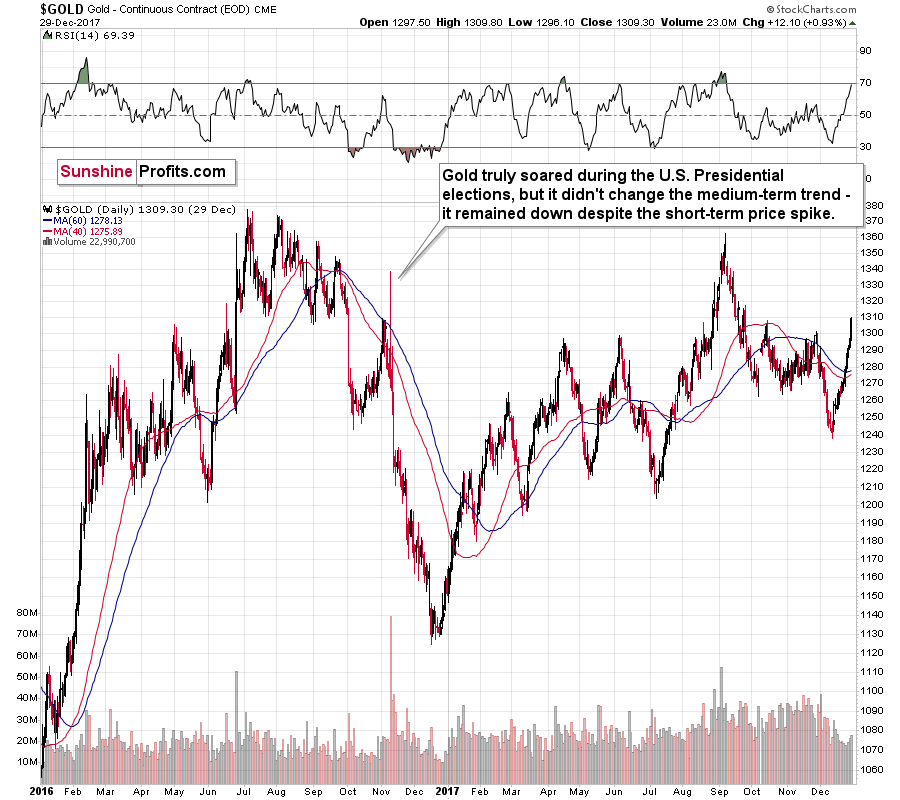
Gold truly soared during the 2016 U.S. Presidential elections, but it didn't change the medium-term trend - it remained down despite the short-term price spike.
The election-based price spike took place after a corrective short-term rally.
And what happened yesterday and in the preceding days?
(Click on image to enlarge)
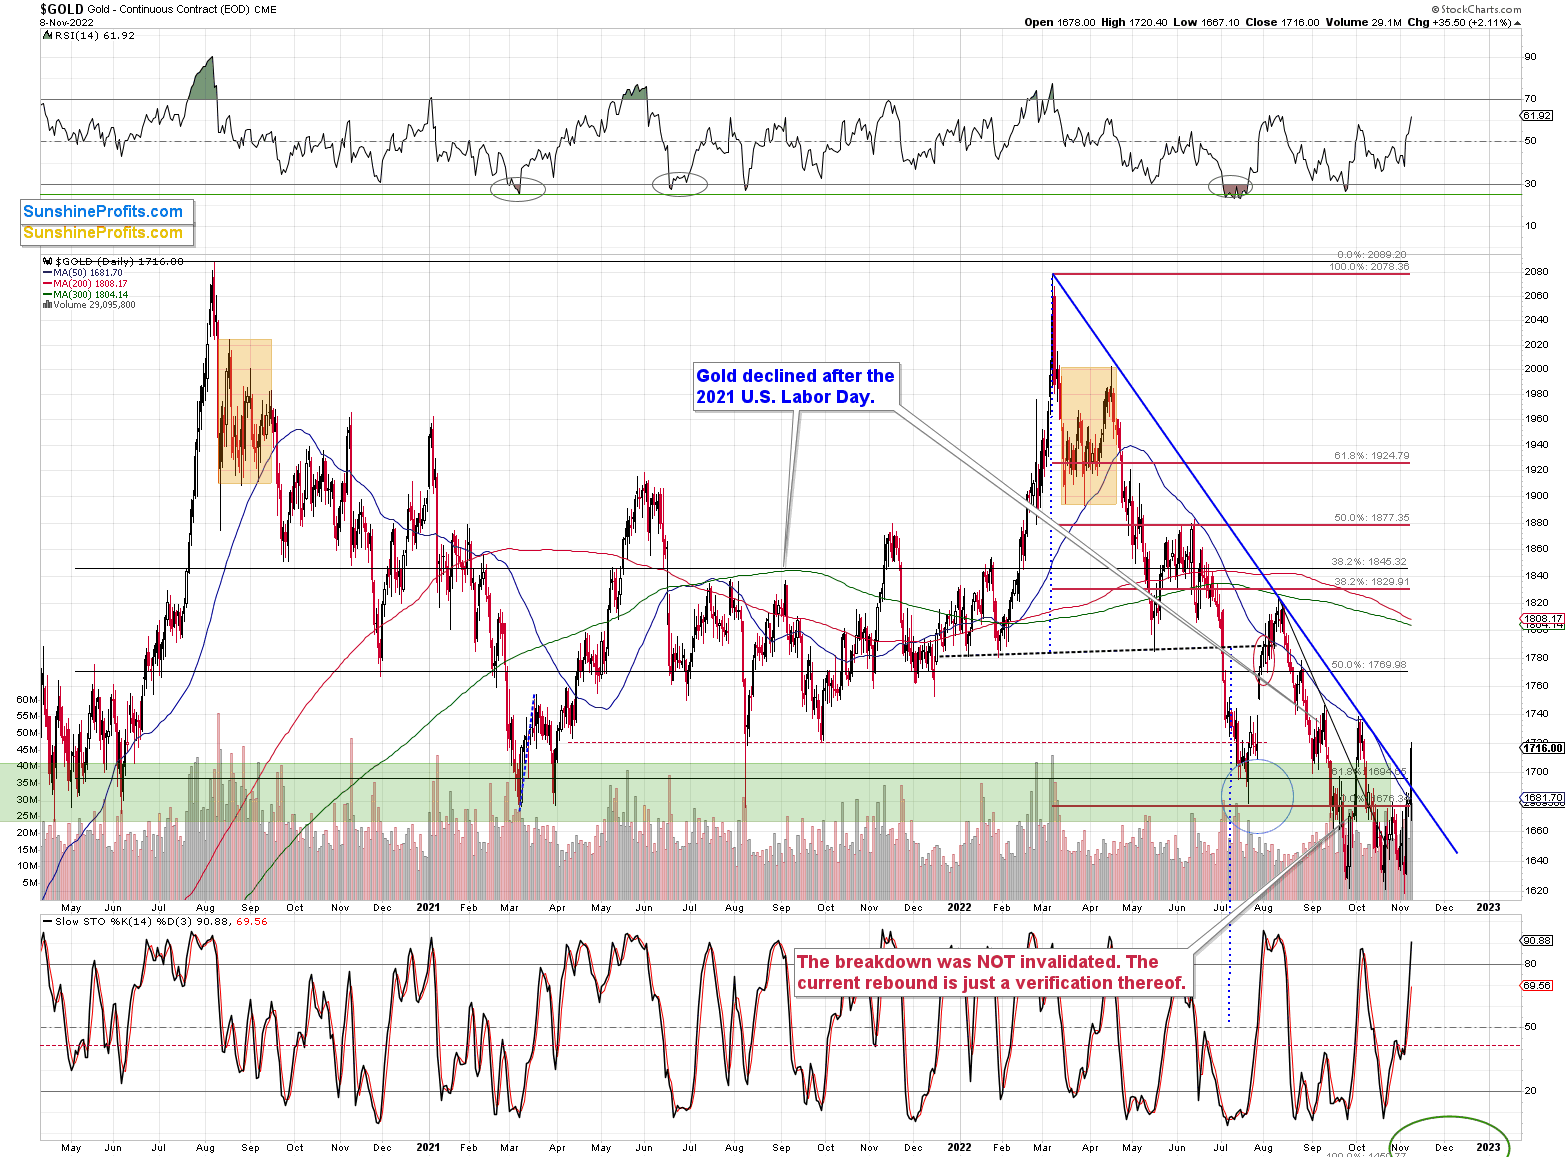
Gold moved sharply higher after a short-term rally. The history tends to rhyme, so I doubt that yesterday’s price action is able to trigger a sustainable rally.
That was just a single daily close above the declining, medium-term resistance line (marked with blue), and the 50-day moving average. Will this breakout be confirmed? Again, I doubt it.
Interestingly, based on yesterday’s rally, the gold-based RSI moved slightly above 60. That’s exactly what happened back in 2016 after the U.S. Presidential elections. And that was a local top – right before a massive slide. Gold then declined by almost 16% in less than two following months.
If the same was to happen now, gold would move to about $1,450. And yes, that would be in perfect tune with my previous analyses. That’s where we have strong support based on the 2020 lows.
Let’s keep in mind that the two key fundamental drivers of gold price are: the real interest rates, and the USD Index.
The real interest rates are clearly headed higher (nominal rates are going up, and eventually inflation is likely to come down), which is bearish for gold.
And the USD Index…
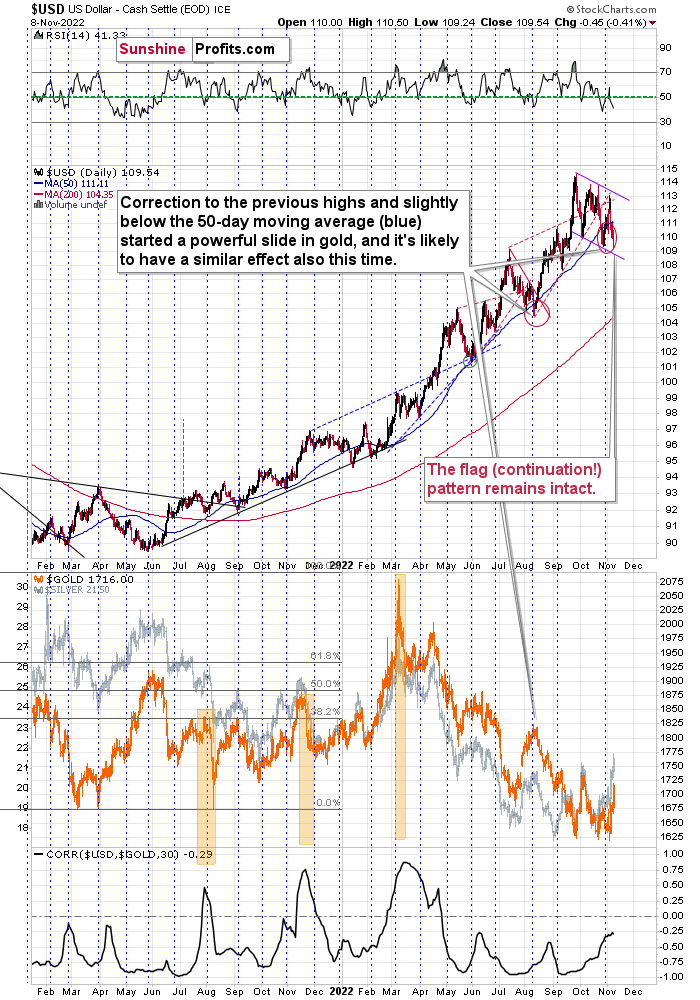
In short, the USD Index remains in its flag pattern that started in September. A flag pattern is a continuation pattern where the price trades sideways (but slightly against the trend) and it continues… until it doesn’t. Quite often, the pattern ends after two or three bottoms. We already had two, and it seems that the third one is about to be formed or it has already formed.
The RSI is slightly below 50 and the USDX itself is a bit below its 50-day moving average (blue line). In the previous months, this combination of factors meant that another sizable rally was just around the corner. As history tends to rhyme, the implications are bullish.
Since March, gold has been moving in the opposite direction to the USD Index, so the implications of the above are bearish for gold and the rest of the precious metals sector.
Why wasn’t gold moving against the USD Index in February? Because of the fear and uncertainty related to the Russian invasion of Ukraine. Please note that the war in Ukraine is still in place, and yet, gold is hundreds of dollars below its 2022 high. This serves as a strong confirmation of gold’s current weakness.
All in all, despite the very recent upswing in gold, the outlook for the precious metals sector remains very bearish in the medium term.
More By This Author:
What Did The Dollar Have to Do With Gold’s Nov. 7 Rally?
This Is Why Friday’s Rally Was Nothing To Worry About
The GDXJ Has A Choice: Rise With The S&P 500 Or Fall With Gold?

Comments
Log in or sign up to join the conversation.