
What Does Kevin Warsh Bring To The Fed?
It appears that President Trump wants Kevin Hassett to remain in his role at the White House. With the supposed frontrunner to replace Powell out of the running, the nomination now seems open to Kevin Warsh. As the graph below shows, Polymarket bettors are assigning 60% odds that Kevin Warsh will be nominated. Given this, we must ask, what does Kevin Warsh bring to the Fed?
Most importantly, Kevin Warsh, unlike Hassett, is not an obvious policy dove. He is an outspoken critic of QE, not because it doesn’t stabilize financial markets when the Fed wants it to, but because it distorts pricing and encourages excessive leverage and risk-taking. A Warsh-led Fed would likely emphasize a smaller balance sheet, clearer exit rules for emergency facilities, and formulaic policy decisions based on real economic outcomes rather than financial-market reflexivity. His ideals would be healthier for markets in the long run, but could be uncomfortable initially for investors who have flourished under many rounds of QE.
Rather than responding to every bout of market stress with interest rate cuts, QE, or new lending facilities, a Kevin Warsh Fed would likely tolerate more volatility as the cost of restoring credibility. In practical terms, that implies tighter financial conditions, fewer “mid-cycle adjustments,” and a higher bar for intervention. Assuming this analysis proves true, investors would lose a dependable tailwind, and valuation—not liquidity narratives—would regain its role as the primary driver of long-term returns. Accordingly, active investment strategies may once again prove more rewarding than passive strategies.

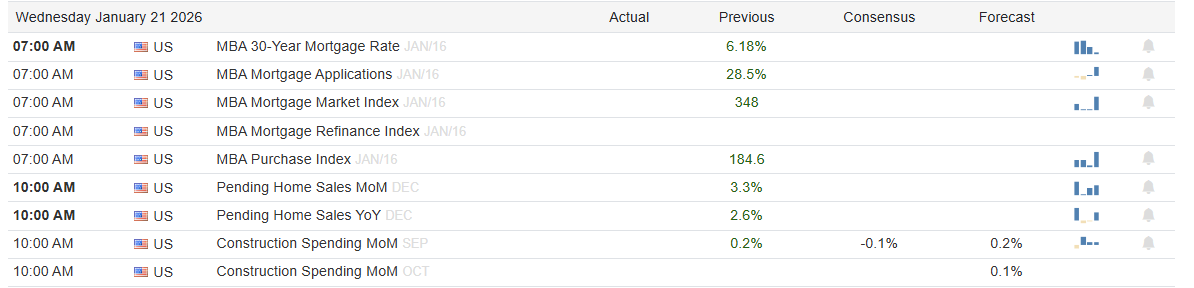
What To Watch Today
Earnings

Economy
(Click on image to enlarge)
Market Trading Update
Yesterday, we reviewed the technical backdrop of the market as we entered this new, holiday-shortened trading week. As we noted:
“From a volatility perspective, U.S. equity volatility metrics remain subdued, although volatility has risen mildly. We could see a further pickup in volatility with earnings season and macroeconomic data releases, which are known to act as catalysts for directional breaks.”
Yesterday, markets sold off at the open after President Trump’s surprise announcement of tariffs on key European allies. Stocks fell here in the U.S., and volatility measures spiked as the dollar dropped. The perceived threat was clear: the President said he would impose 10% tariffs on imports from eight European nations starting February 1, rising to 25% by June if negotiations over Greenland did not progress. This triggered broad risk‑off sentiment among investors.
As we have stated in the past, the thing that always triggers a “risk off” move in the market is an unexpected, exogenous event. That event raises questions about the analyst’s future earnings growth rate and current valuations. The announcement fit that bill perfectly.
While investors were taken off guard, as many had not priced in a renewed escalation in trade tensions, the market will soon come to realize there is more “bark than bite” to the announcement. The President’s move fits a pattern in the president’s policy playbook. Past tariff announcements were used as leverage in negotiations with China, Mexico, Canada, and other partners. In several cases, markets sold off on the headlines, only to stabilize as talks progressed and some threats were softened or agreements were reached. Analysts have dubbed this the “Trump Allocated Conditional Outcomes” or TACO trade, with investors betting higher tariffs will be threatened before being scaled back.
Tariffs serve dual roles and can be used as economic or political tools. Trump uses them to extract concessions or force talks, and investors know this from previous cycles of escalation and partial de‑escalation. The announcement is a pressure tactic as much as a policy change.
For investors, it is important to look beyond the headlines and focus on the underlying fundamentals. Going into the announcement, the market had hit all-time highs and corrections; while painful, are part of a healthy, running bull market. Here are some stats for you.
Since 1928, a 5% correction has occurred in 94% of all market years, with 10% corrections in 63% of them. In other words, you should look at 5-10% corrections as buying opportunities, as those corrections reverse previous overbought conditions. Considering that 20% corrections, as we saw in 2025, occur only 26% of the time (1-out-of-4 years), the probabilities suggest that a 20% correction, or worse, is a lower-probability event in 2026.

However, anything is certainly possible, and the market’s outcomes will depend on how this unfolds. A negotiated easing would likely calm markets and reverse some of the sell‑off. A prolonged trade standoff with retaliatory tariffs would pressure global growth and corporate earnings and sustain volatility.
For investors, this means preparing for higher volatility. Volatility is now priced into risk assets, and traders and longer-term holders should use disciplined approaches. Expect wider trading ranges. Review exposure to sectors sensitive to global trade. Prioritize risk management and avoid overleveraging around headline events. Use pullbacks as opportunities to evaluate fundamentals rather than reacting emotionally. The market’s response reflects policy risk, not economic data.
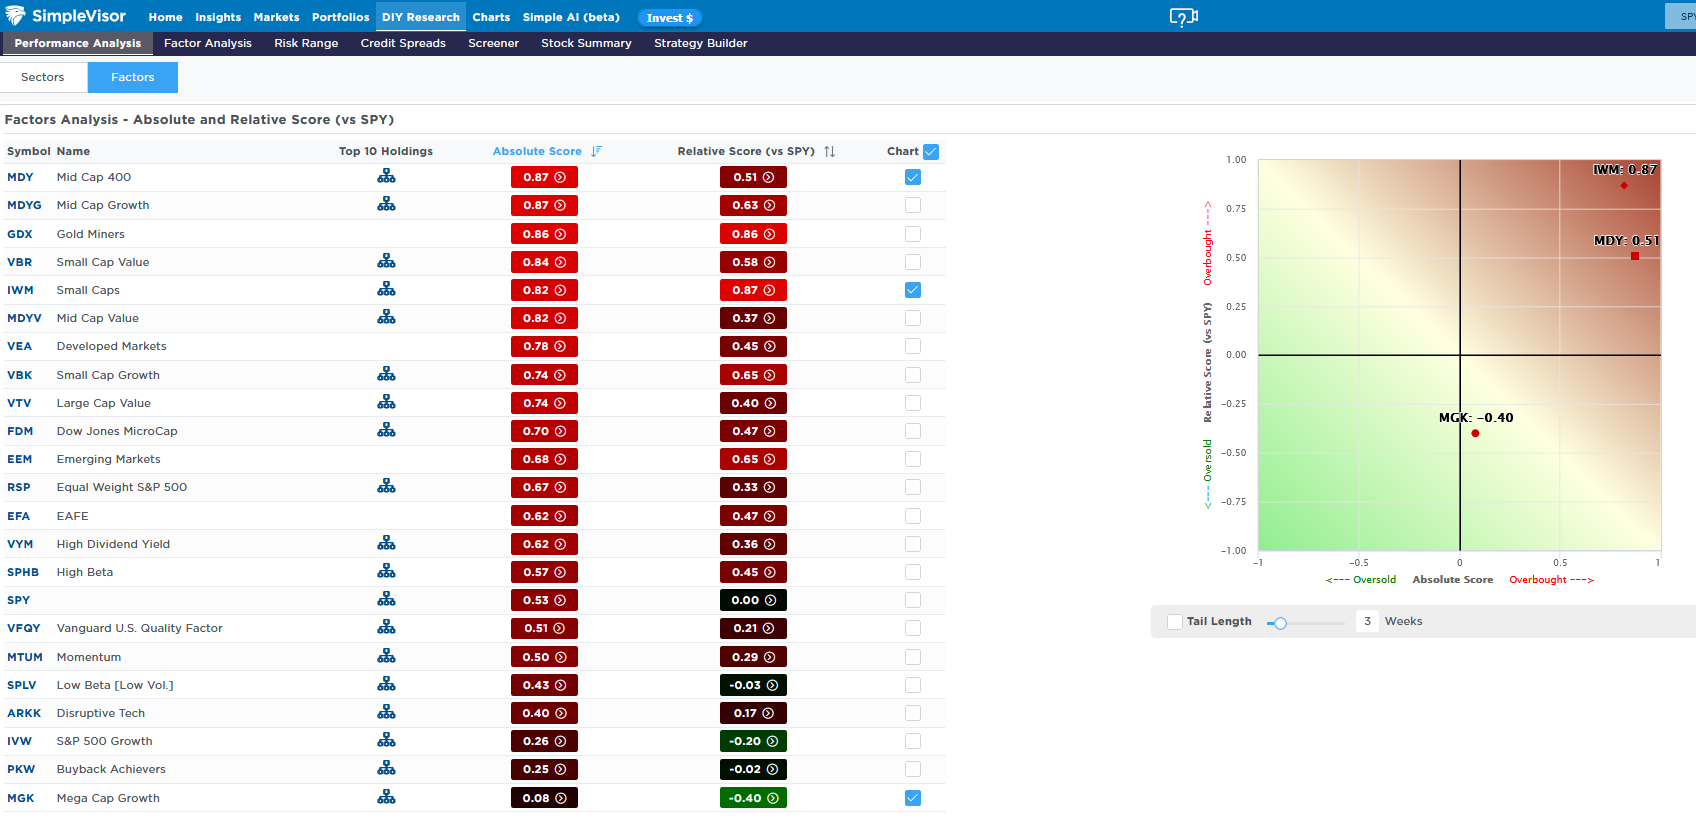
Size Matters
The markets have sent a clear message over the last few weeks: small and mid caps are investor favorites while large and mega caps are, for the first time in a long time, out of favor. While it’s tempting to sell the large megacap stocks and buy into the current fad, we offer caution. Note below that the absolute scores for the small and mid-cap sectors are grossly overbought, and their relative scores are similarly very overbought. Conversely, the mega-cap ETF (MGK) is fairly valued on an absolute basis but is decently oversold relative to the market.
2026 may be the year that small and mid-caps finally outperform larger stocks, but we caution that the current rotation into these sectors is getting very overdone. We advise waiting for a counter rotation before making any significant portfolio changes.
(Click on image to enlarge)
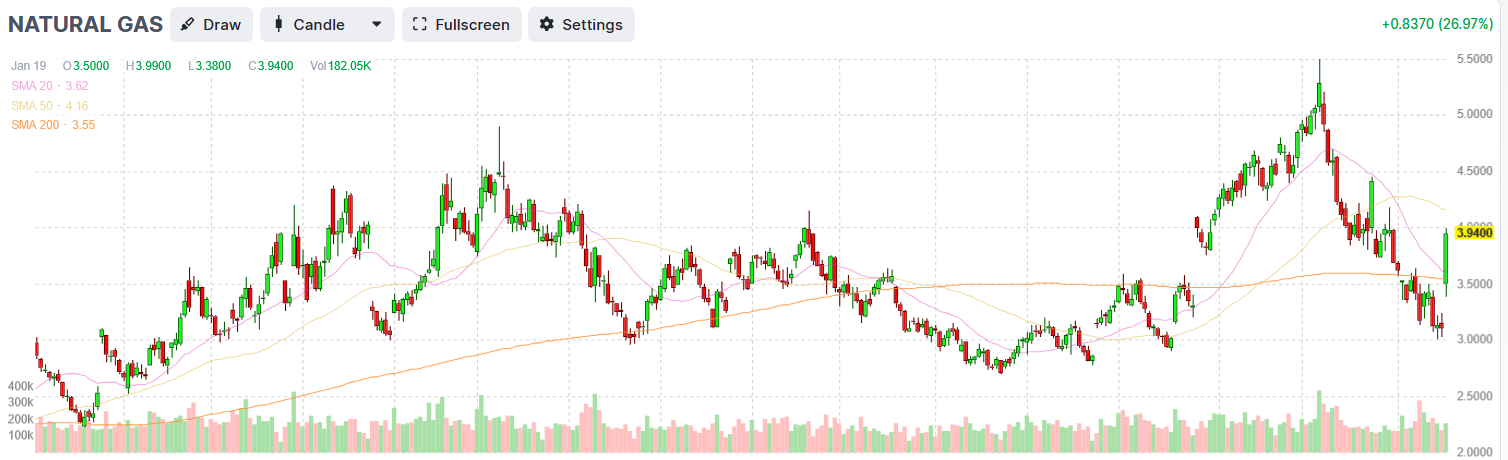
Natural Gas Prices Surge
The latest weekly forecast calls for an Arctic airmass to cover the Midwest and the Northeast. As a result, natural gas prices jumped by over 25% on Tuesday’s open, making it the 3rd largest daily gain in history. Meteorologists estimate that temperatures will be up to 25 degrees below average across the Northeast and Midwest of the US over the coming ten days. As we share below, the price of natural gas is up sharply but well below the $5.50 peak set in early December. Natural gas prices tend to be heavily correlated with weather forecasts. Thus, given the severity of the cold, the surge is not surprising. The question will be what the longer-range forecasts for February look like and what impact they will have on prices.
(Click on image to enlarge)
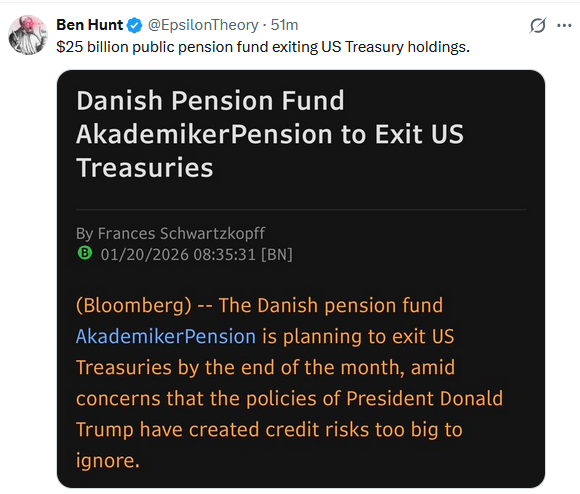
Tweet of the Day
More By This Author:
The Money Supply Myth: Context Matters
Rotation Continues As Markets Remain Bullish
AI Productivity, Employment And UBI
Disclaimer: Click here to read the full disclaimer.


