
Two Trades To Watch: EUR/USD, Oil Forecast - Thursday, Sept. 4

Image Source: Pixabay
EUR/USD steady around 1.1650 ahead EZ retail sales & US data
- EZ retail sales are expected to fall -0.2%
- US JOLTS job openings fall to a 10-month low
- EUR/USD consolidates below 1.17
EUR/USD is holding steady around 1.1650 after Eurozone retail sales. Expectations are for retail sales to phone 0.2% after rising 0.3% in June.
The data comes after PMI data yesterday showed that growth in the eurozone economy was lacklustre. However, with inflation around the 2% level, the ECB is not expected to cut interest rates again next week. ECB hawk Isabel Schnabel said she doesn't see the need for further cuts at all.
The USD is inching higher versus its major peers after losses yesterday as the market awaits further insight into the health of the US economy, particularly the labour market, following yesterday's job openings report and ahead of tomorrow's key non-farm payroll report.
The JOLTS job openings fell in July to its lowest level in nearly a year, adding to other data that has shown a gradually weakening labour market. Available positions fell to 7.18 million from a downwardly revised 7.36 million in June, below economists' expectations for 7.4 million openings.
The fall in vacancies suggests that companies are becoming more cautious with their hiring as they attempt to gauge the impact of Trump's trade policy on the economy. ADP payroll and jobless claims data today will provide further clues on how the labour market is holding up. While ISM services PMI will shed more light on the dominant sector in the US economy.
The Fed may be forced to cut interest rates due to the weak jobs market, even if inflation is above target. Weak data today could support Fed rate cut expectations and pulled the US dollar lower
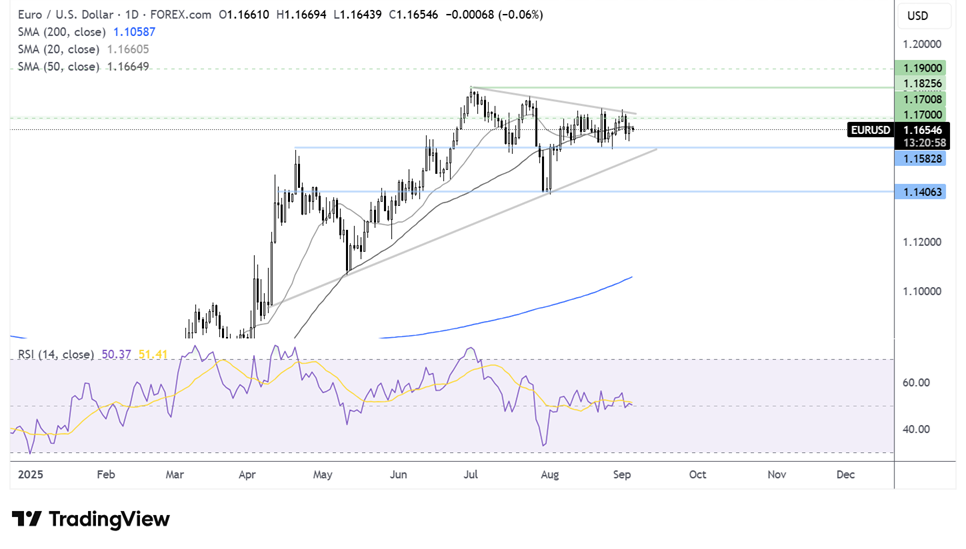
EUR/USD forecast – technical analysis
EUR/USD is consolidating below 1.17. After another failed attempt to retake the 1.17 level, the pair is hovering on the 50 SMA, awaiting further cues. The RSI is neutral.
Buyers need to break out above 1.17, the round number and falling trendline resistance to create a higher high and bring 1.1830, the 2025 high, into focus.
Support is at 1.1580, last week’s low. A break below here exposes the rising trendline resistance at 1.1540 ahead of the 1.14 August low.
(Click on image to enlarge)
Oil falls as OPEC+ plans to increase output
- OPEC+ to discuss output hikes for October
- API crude oil stockpiles rose 0.6 million barrels
- WTI oil faced rejection at the 50 SMA, rebounding lower towards 63.00
Oil prices are extending their decline amid rising expectations that OPEC+ will increase its output at a time of growing concern over higher supply.
With OPEC+ aiming to increase market share, it could start unwinding 1.65 million barrels per day of output cuts, around 1.6% of global demand. The oil cartel has already agreed to increase output by roughly 2.2 million barrels per day between April and September. This comes alongside an additional 300,000 barrels per day increase from the UAE. The prospect of more supply is pressuring prices.
US crude inventory data is adding to the bearish tone as API data showed crude inventories rose by 622,000 barrels. The unexpected build points to weaker demand and slower refinery activity, reinforcing downside momentum.
Attention will turn to U.S. data with jobless claims, the ADP private payroll, and ISM services PMI figures. All right, Peter, provide fresh cues on the Federal Reserve's policy outlook for September.
The data comes after weak job opening figures yesterday and ahead of the key nonfarm payroll report on Friday.
Signs of a slowing U.S. economy combined with increased supply may keep oil on a downward trajectory.
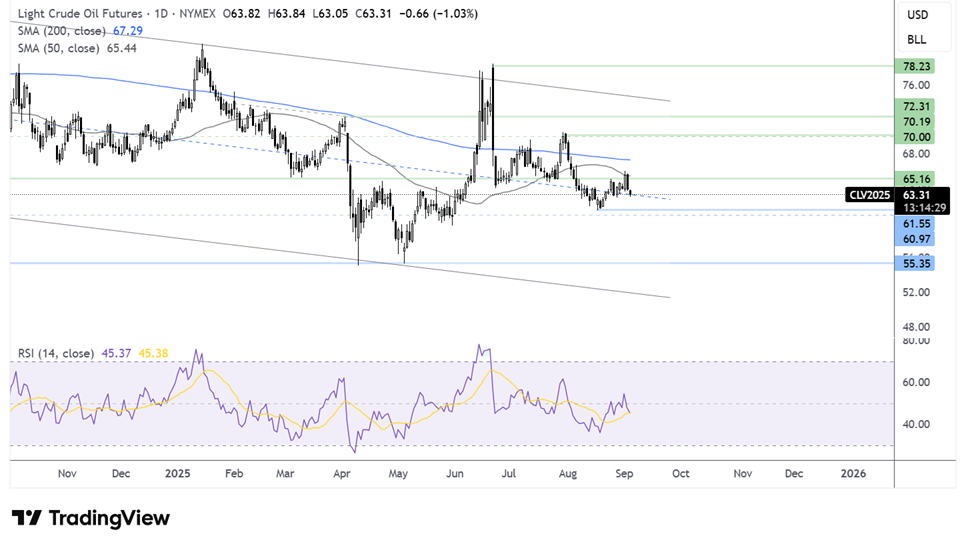
Oil forecast – technical analysis
Oil trades within a descending channel dating back to 2023. The price trades below its 200 SMA in a bearish trend. Oil failed to rise above the 50 SMA and the 65.00 round number, rebounding lower, with the RSI below 50 highlighting bearish pressure. Should sellers extend the bearish move below 61.45, the August low, and 60.00 round number, this creates a lower low and could spur a deeper selloff towards 55.00.
(Click on image to enlarge)
More By This Author:
Two Trades To Watch: GBP/USD, DAX Forecast - Wednesday, Sept. 3
Two Trades To Watch: EUR/USD, USD/JPY Forecast - Tuesday, Sept. 2
Two Trades To Watch: DAX, FTSE 100 Forecast - Monday, Sept. 1
Disclaimer: StoneX Financial Ltd (trading as “City Index”) is an execution-only service provider. This material, whether or not it states any opinions, is for general information ...
more

