
Since the beginning of 2022, the price of gold has remained stable or slightly down. It has even risen slightly in euro terms. In this article, we will try to decipher the movements that can be expected for gold in 2023. At the end of 2021, we gave an overall neutral analysis on the gold price for the year 2022 (2022 Will Mark Gold’s Entry Into A New Cycle Phase).
"What can we expect to happen to the gold price then, ideally, in 2022? If we refer solely to the information that is provided to us by the modeling of the past prices, one could imagine the gold price remaining stable, overall, between now and the end of 2022 [...]".
We also pointed out how great the risk of a rapid disruption of gold prices was ("the price of gold will undergo some powerful fundamental readjustments in 2022"). The study of the cyclicality of gold was very accurate in anticipating the trends in the gold price in 2022. In this first publication, we will apply ourselves to deciphering the possible movements to be expected in the gold price in 2023.
2022: The year of all adjustments?
In the first half of 2022, the price of gold experienced great turmoil. After remaining stable from January to February, the price of gold soared by more than 14% between February and March due to the conflict in Ukraine. In fact, Russia is the second largest gold producer in the world and its importance in the gold market is significant. However, this bullish push was mainly driven by artificial demand from funds. The strong upward movement could not continue like this.
Between March and July 2022, there was a decline in investment demand and an increase in mine production (supply) in the gold market. As a result, the price of gold quickly returned to its pre-crisis levels. Moreover, since the spring of 2020, the $1,700 level has played a major supporting role. In effect, mining supply seems to reduce the quantities of gold produced when the price of gold falls below $1,700, which mechanically generates a major support zone (Mining Companies: What are Their Attitudes Towards Gold?). Finally, gold has experienced since 2019 a period of recession first and a period of inflation second. Thus, gold performed more than +20% in 2019, followed by more than a performance of nearly +22% in 2020. As a result, gold took a break in 2021 (-3.5%) and has confirmed this movement so far in 2022. This pause in the gold price unfortunately comes in a very inflationary context. In a previous article in April, we also stated that "unsurprisingly, and in correlation with our analysis on gold, it is likely that current inflation will experience slight decreases by 2023."
Entering a new cycle: What movements can we expect in 2023?
In our late 2021 publication, we used the cyclical index method. The cyclical index represents the average of all past cycles (over the period 1968-2022). We generally observe a good symmetry between the current evolution of gold prices and the average evolution of past prices. Thus, for the year 2022, the cyclical index showed a theoretical average performance of -1.53% (with, however, significant risks of deviation, with occasional falls of nearly 20% or rises of more than 10%).
The study of historical prices, therefore, suggested a stagnation of the price of gold in 2022. However, the position of the gold cycle also showed the high probability of a sudden movement in the gold price, often associated with a crisis situation (war, recession, etc.). The geopolitical crisis in Ukraine has confirmed our outlook. The chart below shows the cyclical index (black continuous curve, it is the average of the prices between 1968 and 2022), as well as the current level of the index (discontinuous curve) which represents the price of gold from a base of 100 in 2013. It can be seen that there is a very good symmetry between the past prices and the current evolution of gold. The crisis of the war in Ukraine has also respected the symmetry of the gold price with its historical evolution. In addition, the recent low observed around $1,700 per ounce is also a recurring low in the past.
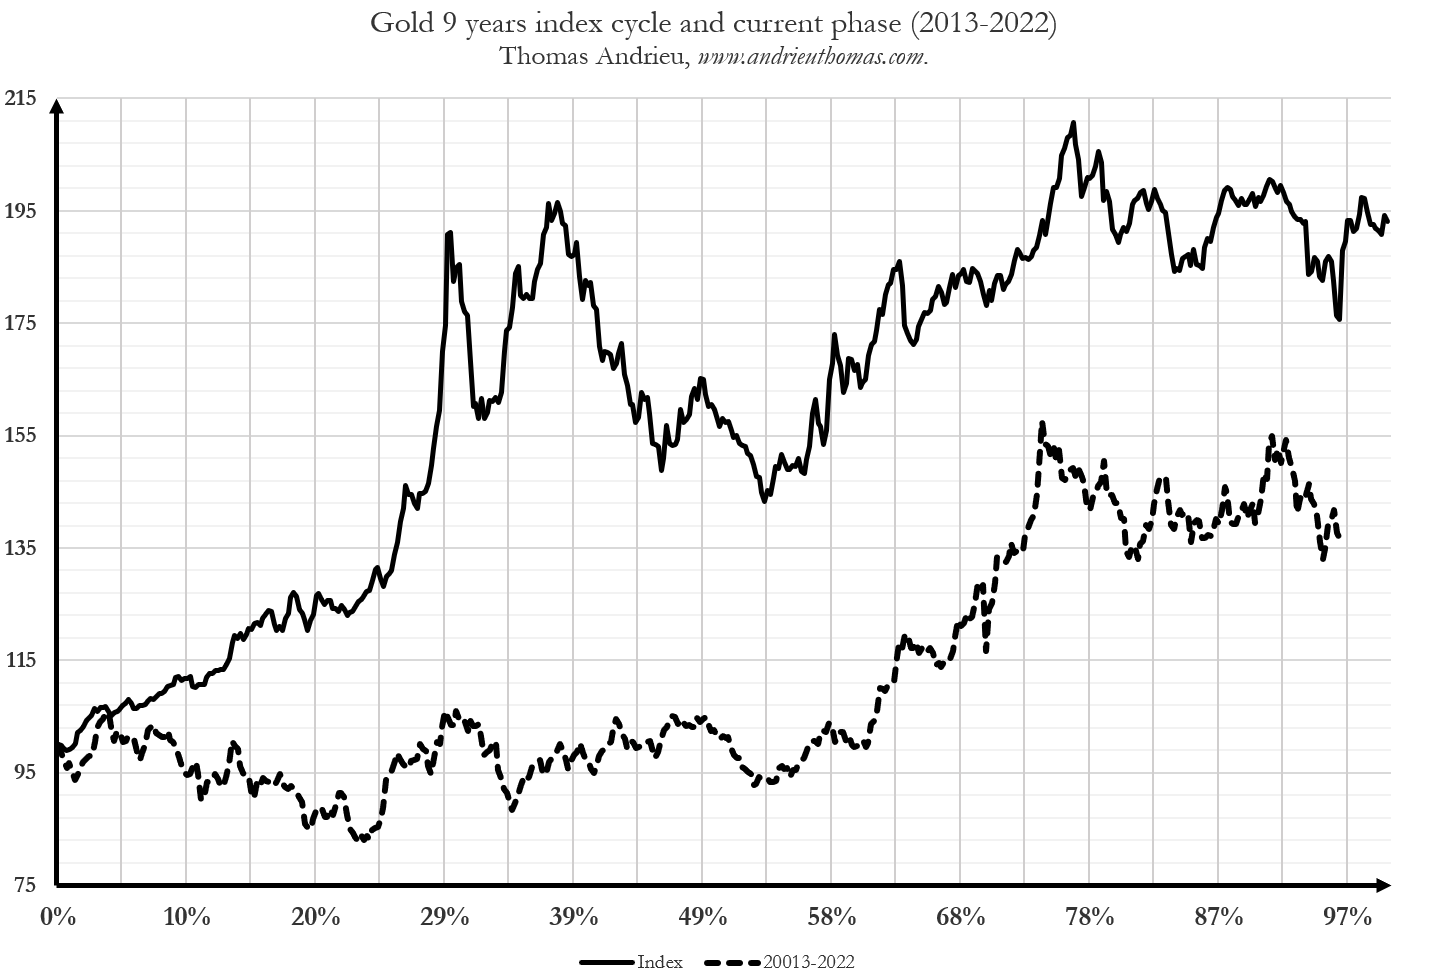
From now on, the end of the year 2022 will confirm the entry into a new phase of the historical 9-year cycle. From a historical and statistical point of view, the year 2023 will drive the "first tenth" of the coming cycle (2023-2032). The beginning of the various cycles generally determines the long-term trend that will follow. Thus, we note that on average, the price of gold performs on the first tenth of the cycle by about +10%. In other words, we can expect that on average, the gold price will perform around 10% in 2023. But this performance could be reduced by the bearish market forces that continue into late 2022. The largest decline recorded in this first tenth of the cycle is about -3.5% (at the start of the cycle in 1995 and 2013). Conversely, the largest returns recorded over this phase of the cycle were +31% (1986-1887) and +16% (1976-1977).
In other words, if the gold price behaves as it has in the past, then 2023 would present little bearish risk compared to the bullish potential. Taking into account the dynamics of the gold price in 2022, it would be fairly consistent to see an upwardly biased recovery in 2023. However, this recovery is historically not significant, and it would only initiate a more pronounced bullish pattern than later. In the opposite case, a decline in the gold price in 2023 would herald several years of possible gold price underperformance. The exit from 2022 will be highly strategic on a temporal aspect.
Cyclical interference and gold prices: spring 2023 horizon?
Cycles are also very useful for anticipating trend reversals. In this sense, several methodologies exist. One of them is inspired by quantum physics and concerns the study of interference. In cycle analysis, a distinction is made between so-called "destructive" interference and "constructive" interference. A destructive interference is associated with a neutral price movement, usually a lower low in the markets. This type of interference corresponds to the combination of two out-of-sync cycles (the high on the first cycle is combined with a low on the second cycle). Constructive interference is associated with the opposite phenomenon and with large amplitudes of movement, often associated with highs.
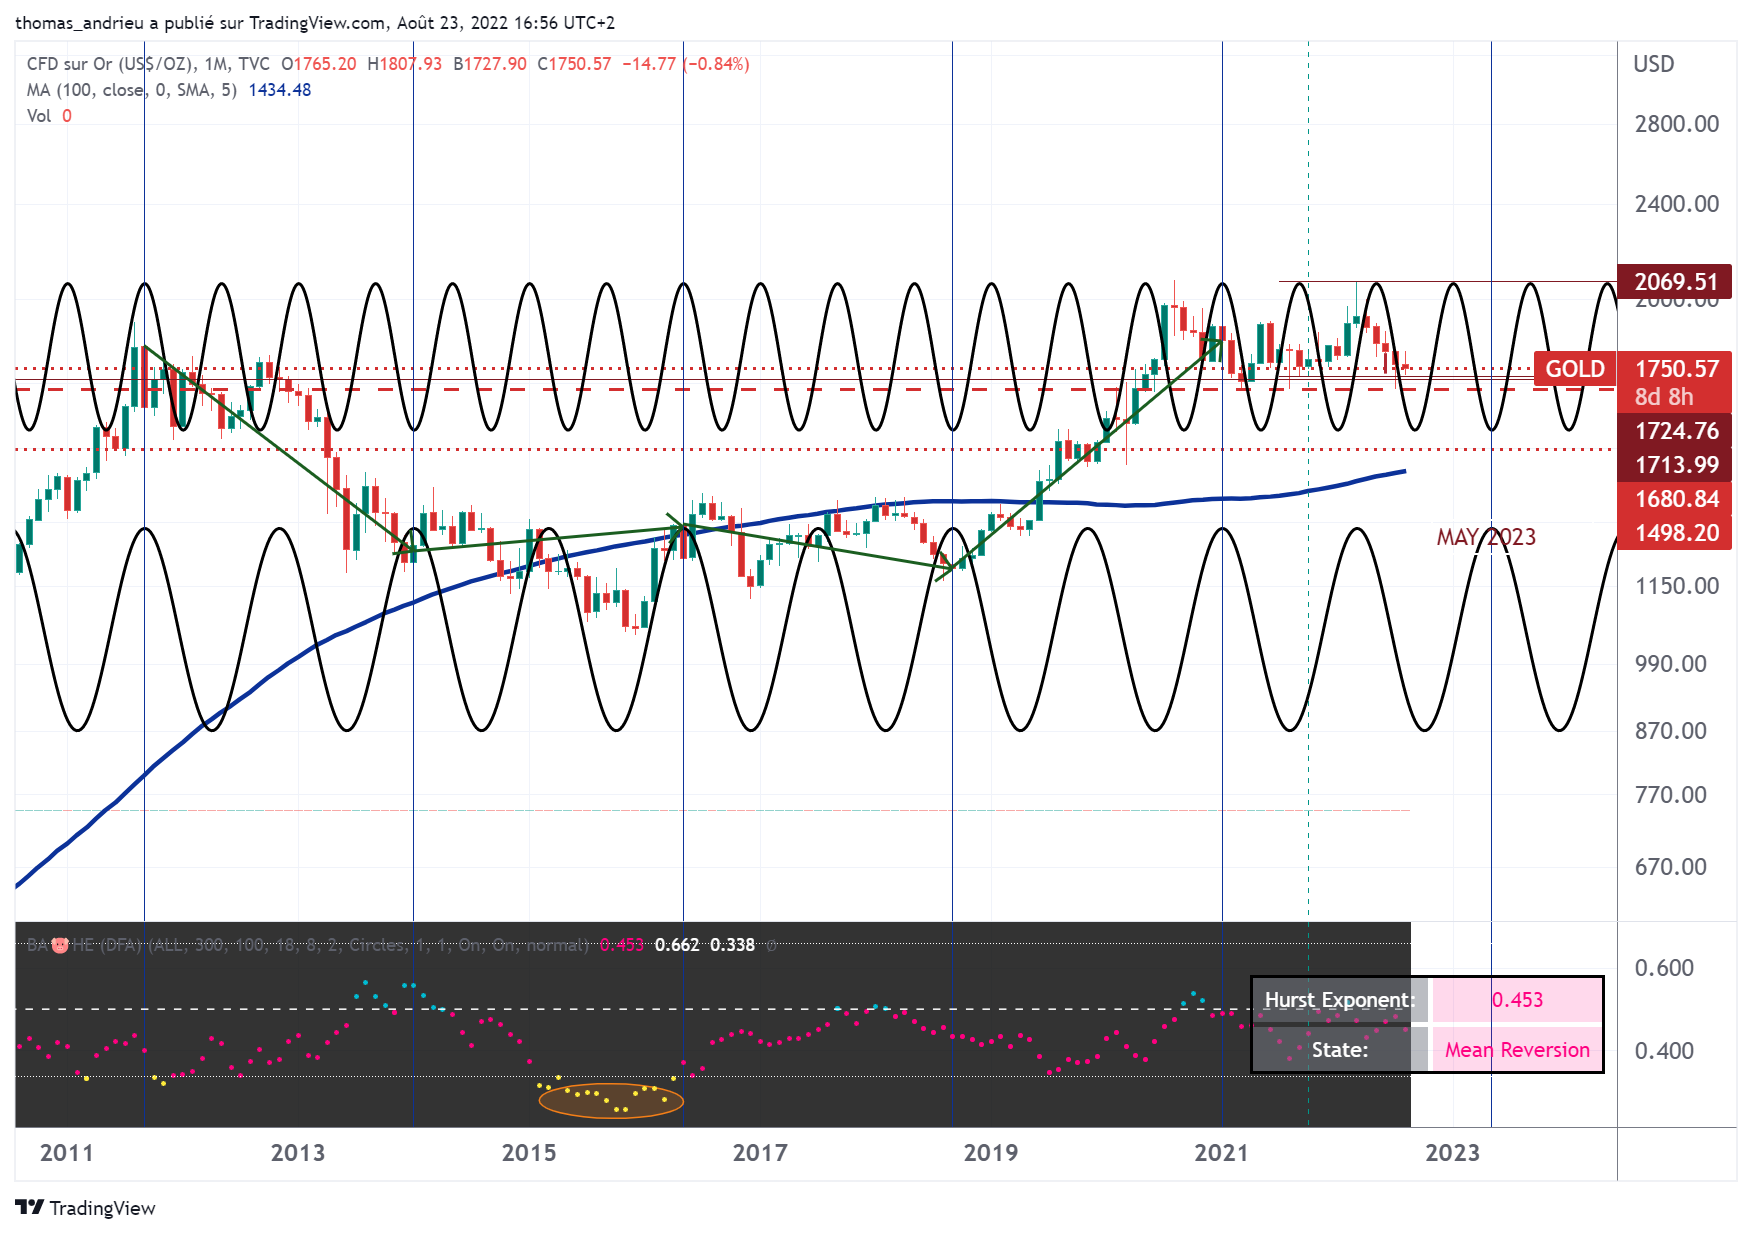
The gold price is an asset subject to interference. The study of interference between the cycles that make up the price of gold is extremely relevant on large time scales. We have thus graphically identified two cycles in the gold price: a first one of fourteen months, and a second one of eight months. Mathematically, we know that these two cycles enter into constructive interference every 56 months (4.6 years). This means that gold is subject, because of these two cycles, to validate a medium-term or long-term peak every four to five years.
Thus, we have represented on the graph above vertical lines that each correspond to an interference (constructive then destructive and so on...). We observe that this model corresponds quite well to the observed movements of gold. Moreover, the last constructive interference (important top) was validated at the very beginning of 2021. Since then, we are heading towards a destructive interference (price neutrality and possible accumulation zone) which would appear around spring 2023. In other words, this is in line with our idea that gold would gradually return to a bullish configuration by the first half of 2023, without any guarantee of amplitude. However, it is quite possible that in the opposite case, long term interferences not identified here will render this hoped-for movement null and void.
European gold investors in good shape
Two figures will suffice to highlight the importance of one's location when buying gold. Since January 1, 2019, that is to say for a little more than three and a half years, gold has performed +36% in dollars, it is +56% in euros! For European investors, therefore, buying gold will have been up to twice as beneficial than for American investors. At the same time, the consumer price index for the United States rose by +16.95%, compared to a rise in the consumer price index in France of almost +10% over the same period.
In other words, gold has significantly enriched investors over the past three years. In effect, the yellow metal has risen twice as fast as the price level in the United States, and more than 5.5 times as fast as the price level in France!
This statistical reality also hides a political catastrophe. Since January 2019 the euro has lost nearly 13% of its value against the dollar! Thus, the analysis of the price of the euro is also a determining parameter for European investors. A weakening of the gold price in 2023 would mean a better performance of gold in Europe, which would be the opposite in the case of a strengthening of the euro price.
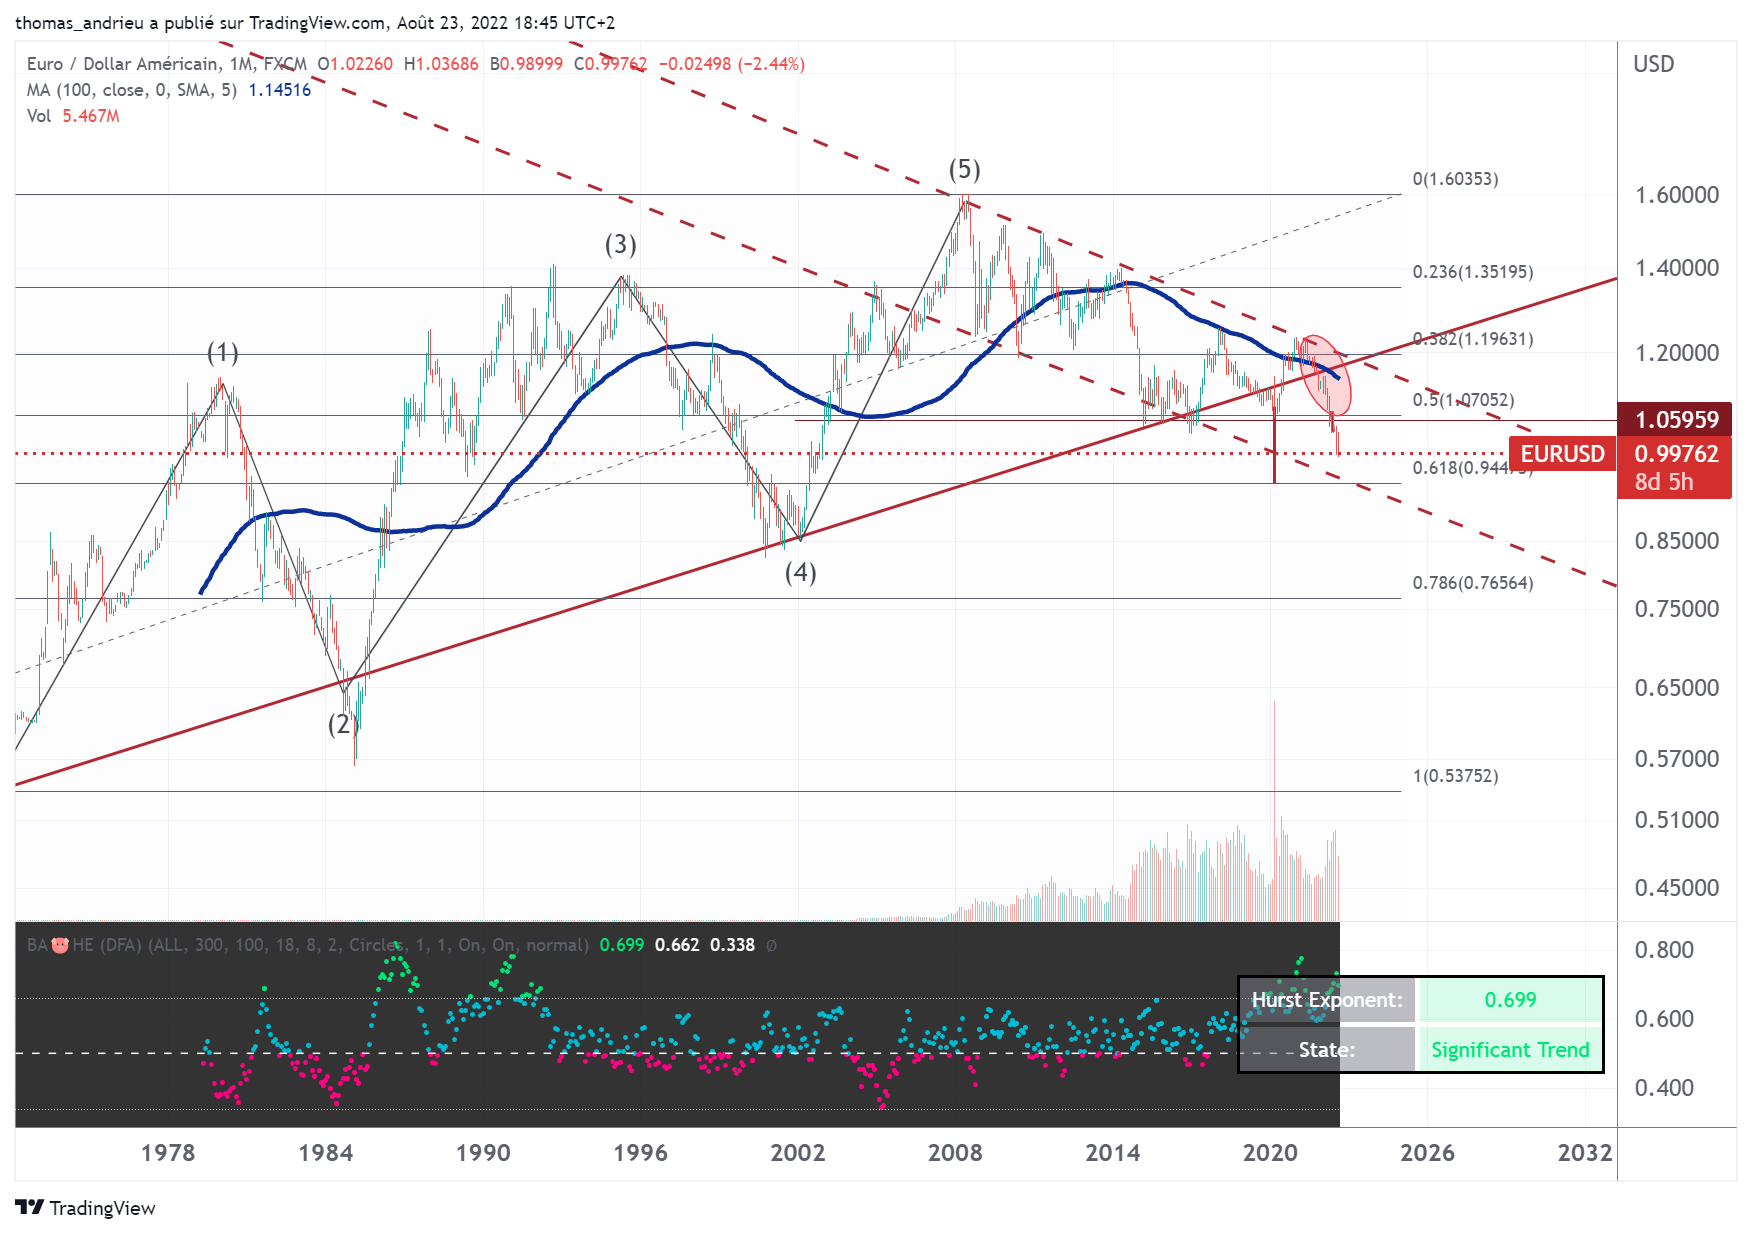
In 2022, the euro marked a serious weakening of its historical trend. The chart above shows the rate of the euro or equivalent since the first attempts at economic union were made with the EMS in 1972. After several major peaks, the euro-dollar rate peaked at 1.60 in 2008. Technically, the euro price had been sitting on the historical trend line since 2017. But the euro's historical downtrend break, with the move below 1.07 in particular (50% of the Fibonacci retracement), makes the euro's environment critical.
If we follow Eliott's theory as well as the bottom of the bearish trendline inserted since 2007, then it is quite conceivable that the EUR/USD will arrive permanently on the 0.95 area (61.8% of the Fibonacci retracement, bottom of the bearish trendline, and objective of the rounding top). Moreover, our fractal indicator represented on a black background also indicates the presence of an increased bearish trend. In this sense, although it is quite possible to see a short-term rebound in the euro, the strength of the trend and the technical movement leads us to remain generally pessimistic about the euro's fate. Widening trade deficits, intra-European financing difficulties, the difficulty of establishing restrictive fiscal and monetary policies, weak growth, and geopolitical posturing are all persistent bearish factors for the euro.
In conclusion
In the end, the year 2022 will have confirmed our expectations. The price of gold has (so far) remained broadly stable with sharp movements linked in particular to the war in Ukraine. However, as we have shown, these movements are symmetrical with the past evolution of gold prices. Although the year 2022 is not over, the prospect of the year 2023 seems to be gradually taking shape.
Using several cyclical methods, one can legitimately expect 2023 to be biased to the upside. However, this would not be a very strong trend, and entering the accumulation zone would be the ideal scenario. Furthermore, in the case of a decline in the gold price in 2023, this would certainly reach the bullish potential of the gold price for the next few years. The presence of good time frames of historical data on the one hand, and the good concordance (interference) of certain cycles on the other hand thus leaves before us the hope of renewed strength in the yellow metal. After two years of strong performance in 2019 and 2020, gold stabilized in 2021 and 2022.
Despite stagnant prices, gold has risen twice as fast as inflation for the U.S. and 5.5 times faster for France since 2019. Indeed, in addition to the natural inflation cycle, instability in certain regions of the world significantly influences asset performance. For example, the instability of the eurozone is largely benefiting European investors who are securing a dual safe haven through gold. The prospect of gold as a long-term hedge has never been so close in the 21st century!
More By This Author:
The Evolution Of The Monetary System Since The 19th Century
Europe, Japan, China: Black Swans Follow One Another
Are Central Banks Still Credible?
Comments
Log in or sign up to join the conversation.