Thursday, November 17, 2022 8:37 AM EST
(Click on image to enlarge)

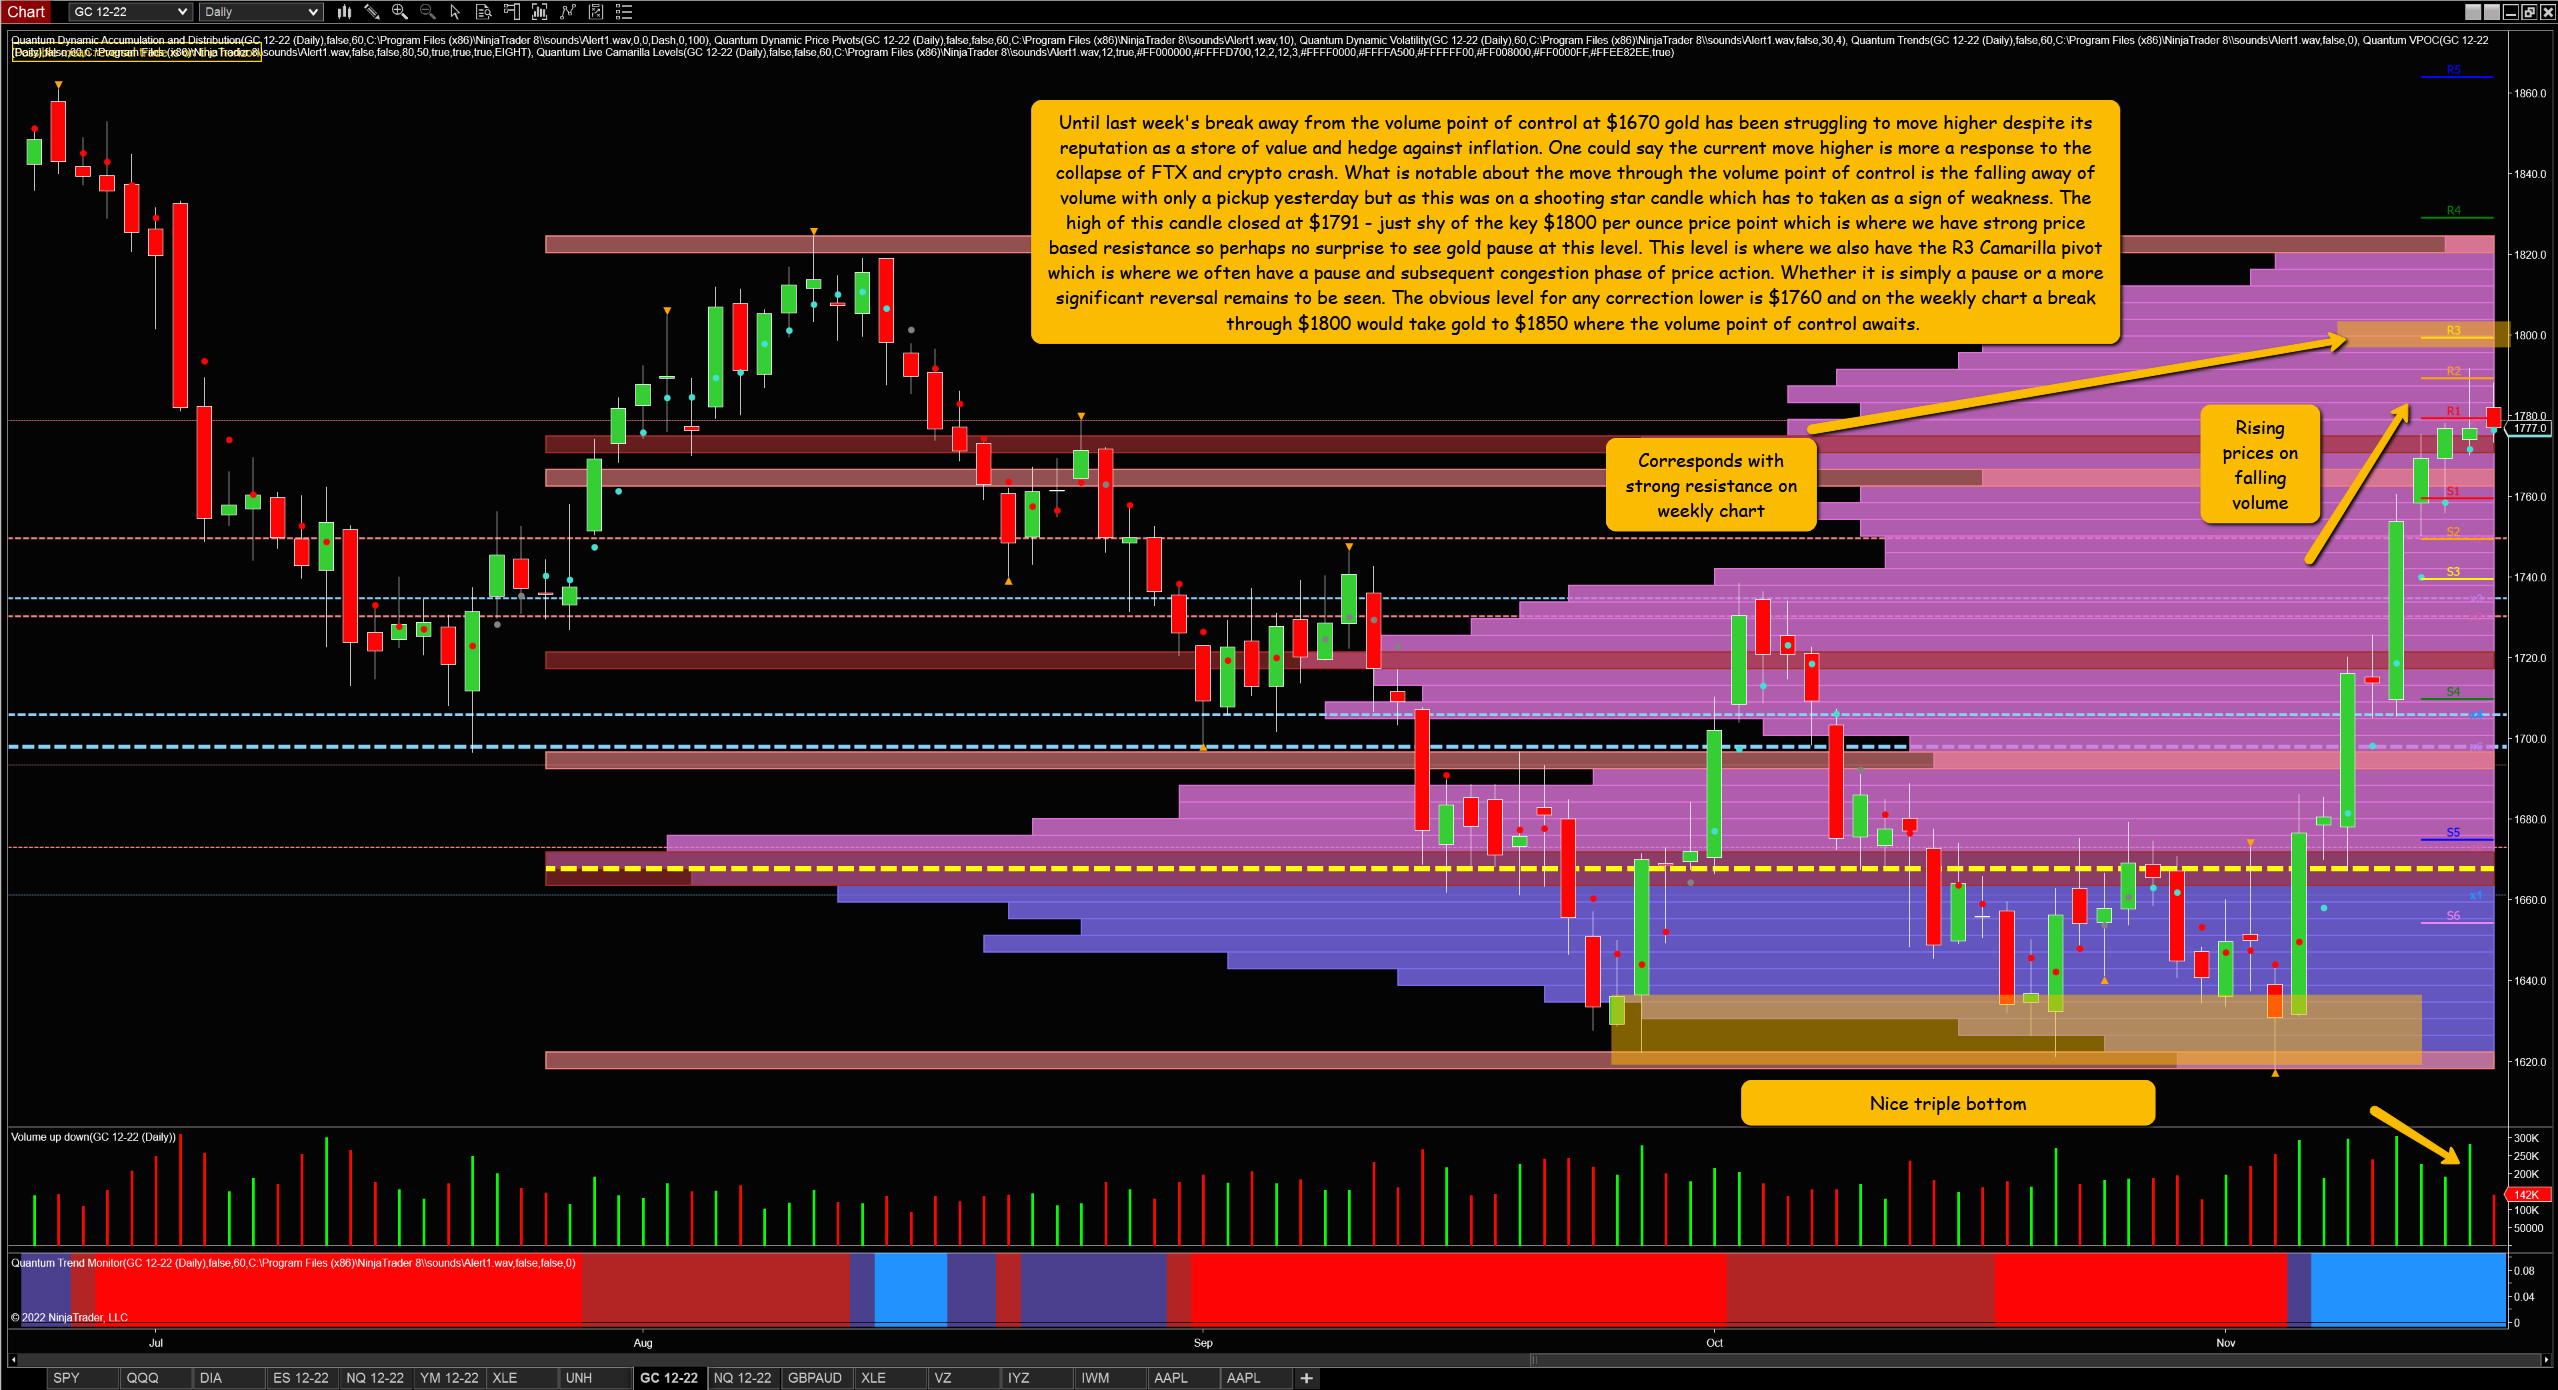
The FTX collapse seems to have been the catalyst to drive gold prices higher, and not the current inflationary environment, as the precious metal finally broke away from the volume point of control at $1690 on the daily chart. From a technical perspective, the triple bottom at $1620 also provided a nice springboard. However, the move higher looks to have run out of steam, as confirmed by the falling volume and the strong price resistance on the weekly chart at $180o per ounce. And since annotating the daily chart, the metal has continued lower and is trading at $1766 at the time of writing, close to the level highlighted on the chart.
(Click on image to enlarge)

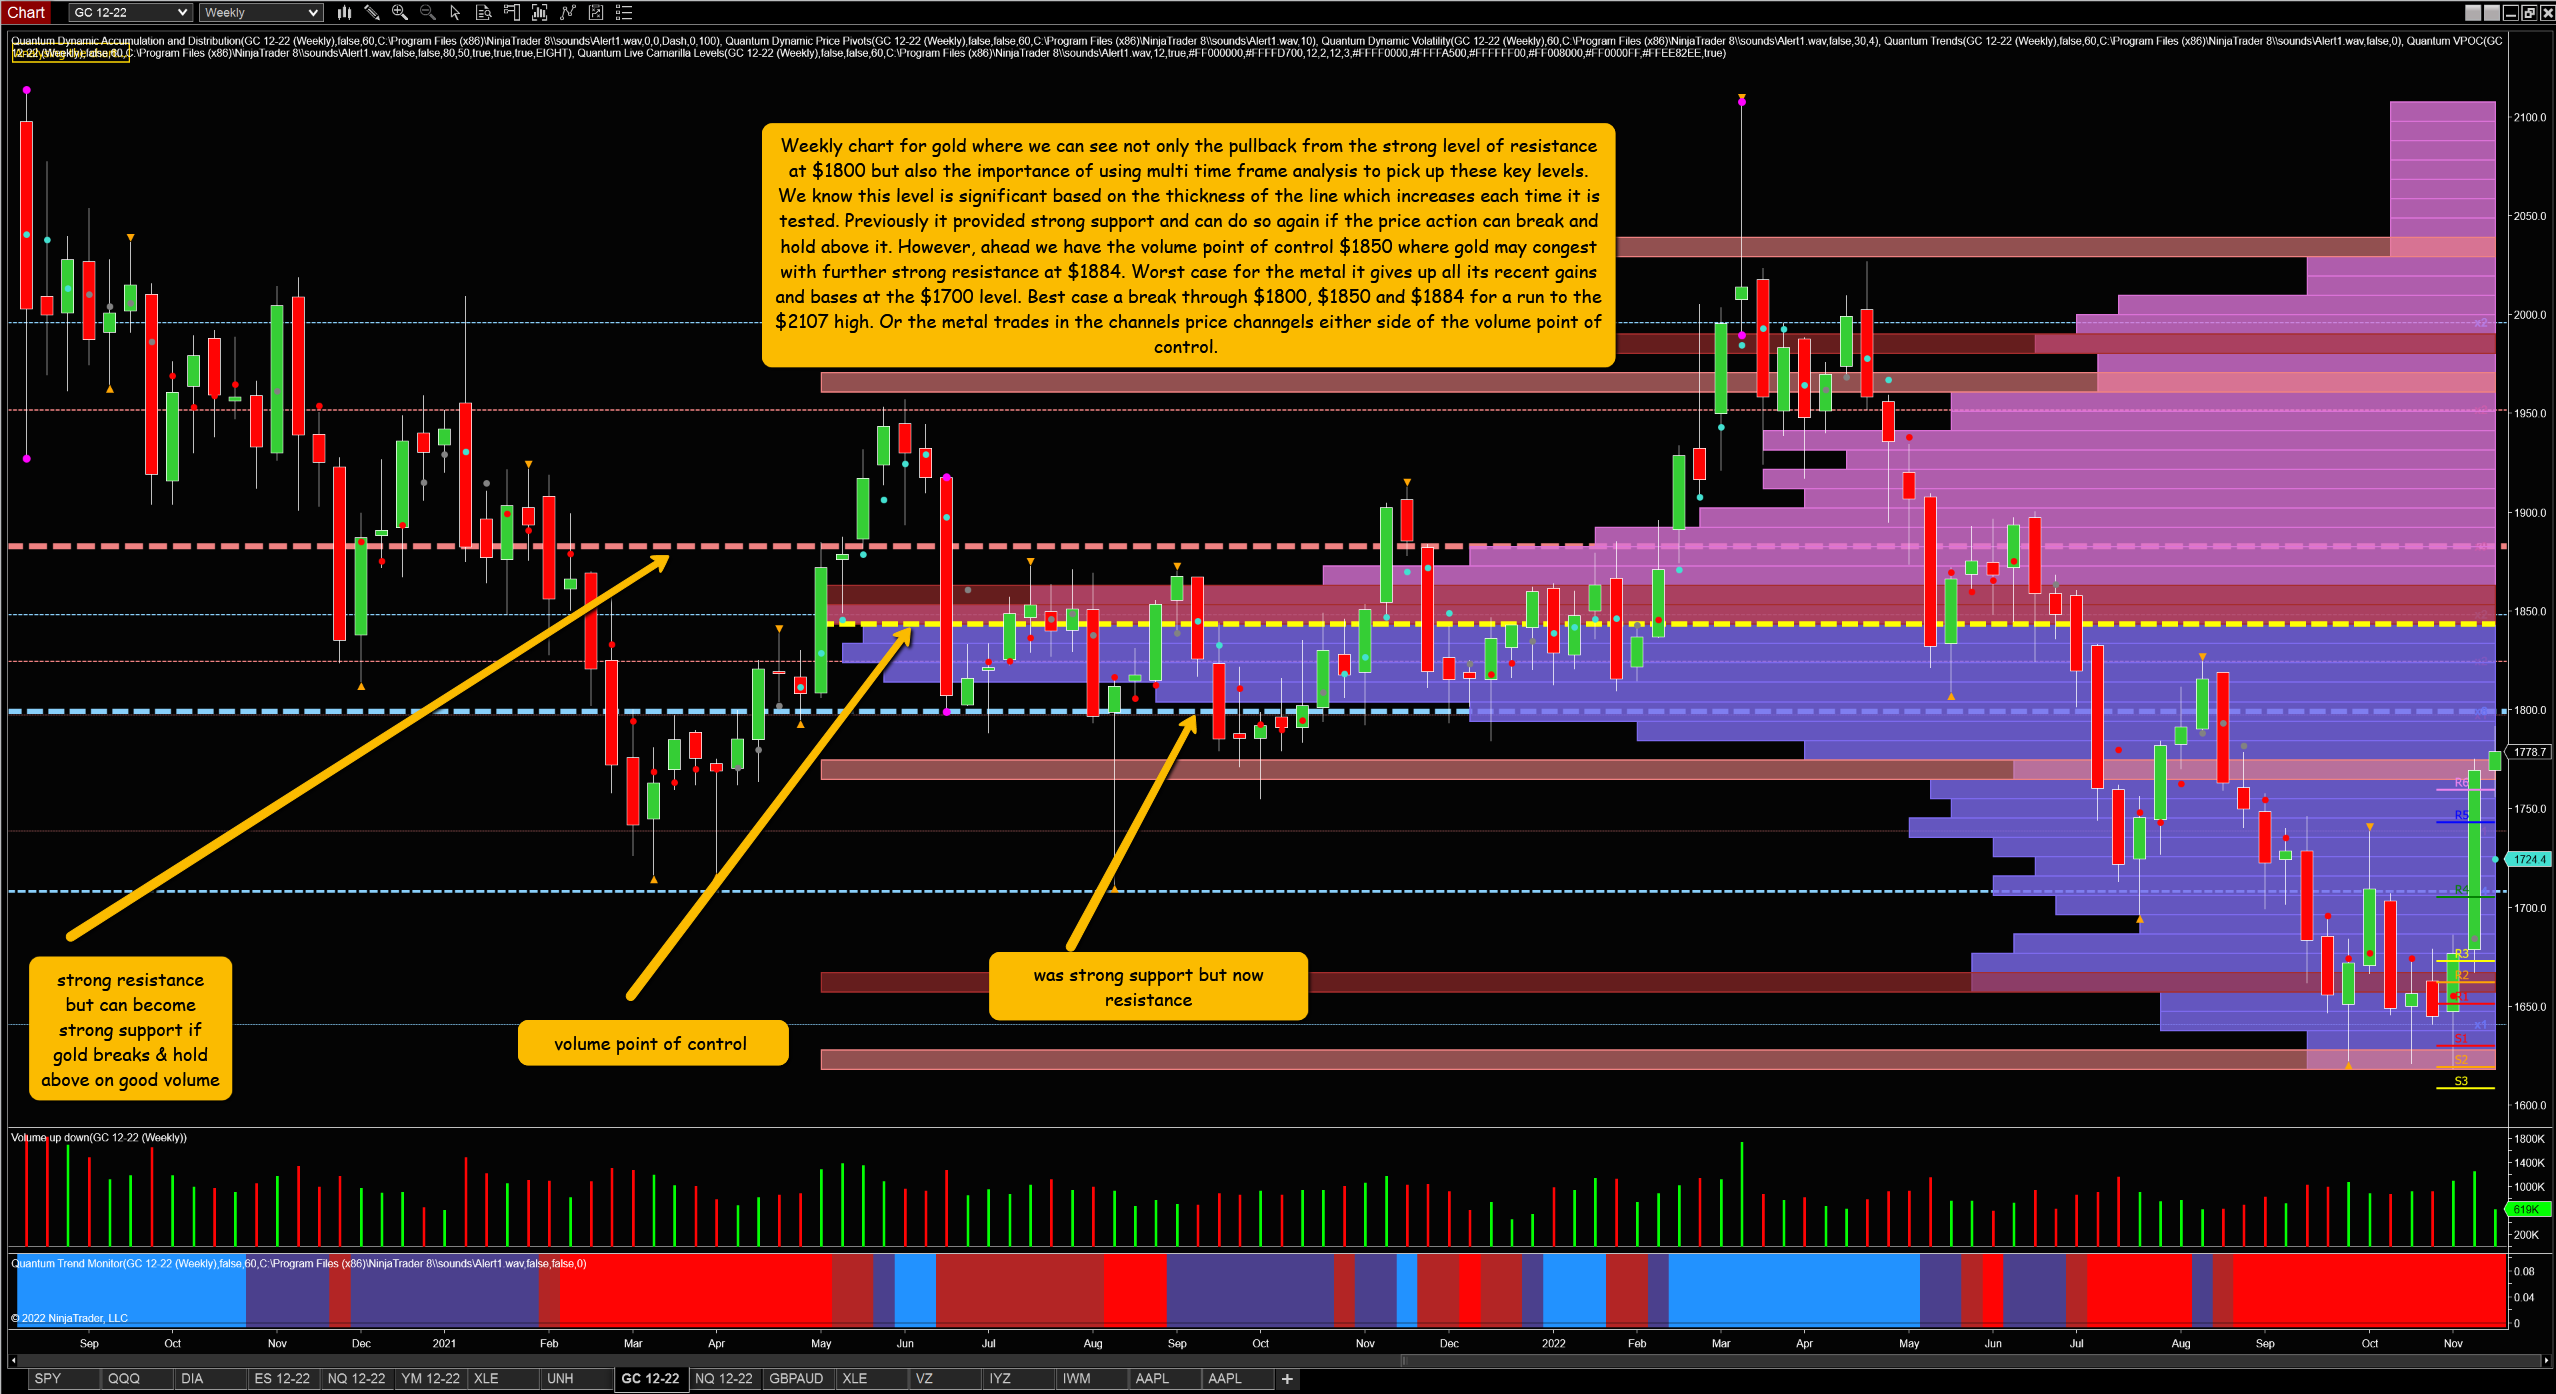
Technical levels are clearly marked on the daily and weekly charts, along with the effort required to move higher. Factors likely contributing to a continuation of the breakout include lots of volumes, further collapses in crypto, a weaker USD, and perhaps a return to gold’s traditional role as a store of value against currency debasement and inflation. Some interesting times ahead for the precious metal.
More By This Author:
After The Fed Just Another Short Squeeze Or Will Fed Change Of Tone Also Support Current Rally? VPA signals on Lumen Technologies
All indicators featured on the charts are my own and available from http://bit.ly/2MAjR8w
Disclaimer: Futures, stocks, and spot currency trading have large potential rewards, but also large ...
more
All indicators featured on the charts are my own and available from http://bit.ly/2MAjR8w
Disclaimer: Futures, stocks, and spot currency trading have large potential rewards, but also large potential risk. You must be aware of the risks and be willing to accept them in order to invest in the futures, stocks, commodities and forex markets. Don't trade with money you can't afford to lose. This website is neither a solicitation nor an offer to Buy/Sell futures, stocks, commodities or forex. No representation is being made that any account will or is likely to achieve profits or losses similar to those discussed on this website. Past performance of indicators or methodology are not necessarily indicative of future results.
CFTC RULE 4.41 - HYPOTHETICAL OR SIMULATED PERFORMANCE RESULTS HAVE CERTAIN LIMITATIONS. UNLIKE AN ACTUAL PERFORMANCE RECORD, SIMULATED RESULTS DO NOT REPRESENT ACTUAL TRADING. ALSO, SINCE THE TRADES HAVE NOT BEEN EXECUTED, THE RESULTS MAY HAVE UNDER-OR-OVER COMPENSATED FOR THE IMPACT, IF ANY, OF CERTAIN MARKET FACTORS, SUCH AS LACK OF LIQUIDITY. NO REPRESENTATION IS BEING MADE THAT ANY ACCOUNT WILL OR IS LIKELY TO ACHIEVE PROFIT OR LOSSES SIMILAR TO THOSE SHOWN.
TESTIMONIALS APPEARING ON QUANTUM TRADING MAY NOT BE REPRESENTATIVE OF THE EXPERIENCE OF OTHER CLIENTS OR CUSTOMERS AND IS NOT A GUARANTEE OF FUTURE PERFORMANCE OR SUCCESS.
less
How did you like this article? Let us know so we can better customize your reading experience.