
Thoughts For Thursday: A Bumpy Ride Gets Bumpier
The three major stock indices were largely unchanged at the close of trading on Wednesday and though morning market futures are deep green it is hard to say that an uptrend is forming.
As the Y-t-D chart for the Nasdaq Composite below shows, 2022 is thus far proving to be a bumpy ride which seems to get bumpier with every passing day.
Y-t-D Chart of the Nasdaq Composite - Close, Wednesday, April 27
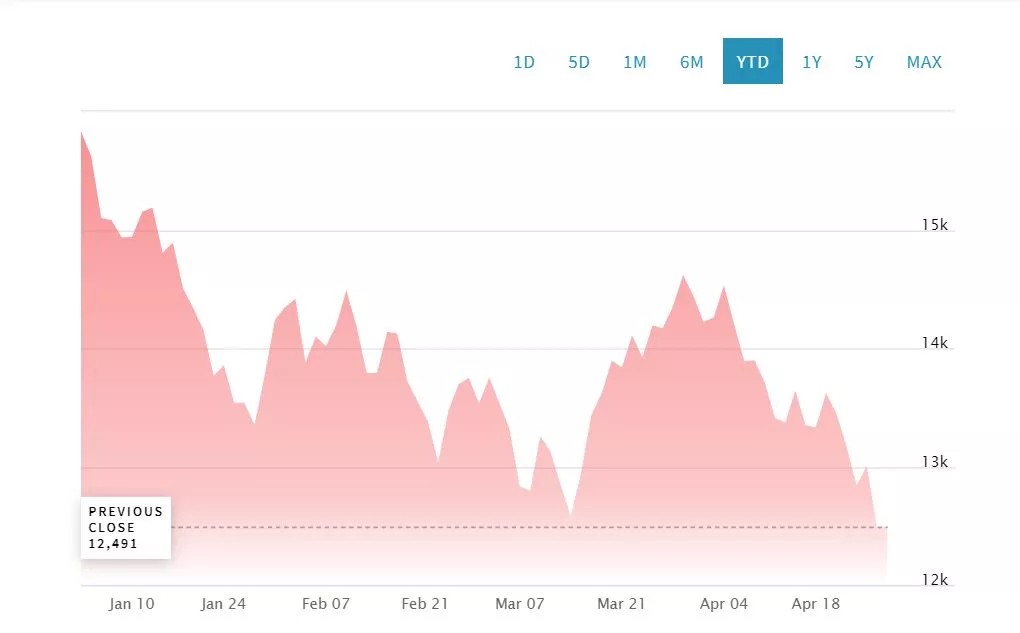
Image: Nasdaq.com
Yesterday the S&P 500 closed at 4,184, up 9 points, the Dow closed at 33,302, up 62 points, and the Nasdaq Composite, closed down 2 points, at 12,489. Currently S&P market futures are trading up 59 points, Dow market futures are trading up 275 points and Nasdaq 100 futures are trading up 255 points.
I've noted yesterday's activity for the 3 major indices above so I'll just add that of the Russell 2000 (IWM) as noted by contributor Declan Fallon in his post of yesterday evening A Last Chance Saloon For Indices.

"The Monday reversal wasn't enough to light a fire under bulls as sellers quickly returned to reverse all of that gain. Indices are now left with just the lows of February to hang on too, but even that is under pressure for the Russell 2000.
The Russell 2000 had looked like it was going to lead a recovery when it broke out of its base in March, but the resulting 'bull trap' did what most 'bull traps' do and reversed all the way back to the lows of the base and then break support. Technicals are net bearish but momentum is at least oversold - although price crashes occur from an oversold condition. Because we have a test of support there is a buying opportunity, but keep the stop tight."
TalkMarkets contributor Ryan Mallory is his daily video recap (47 minutes) of the action goes nothing short of calling current action a Stock Market Crash.
"I'm going over the current stock market crash underway which includes SPY, QQQ, and IWM ETFs as well as going over all of your stocks and charts."
Contributor Ironman charts the ups and downs of the S&P 500 in his article Increasing Day-To-Day Volatility For The S&P 500.
"Statistically speaking, day-to-day changes in the S&P 500 (SPX) don't start to be interesting until the index changes by more than two percent from its previous day's closing value. But those day-to-day changes get really interesting when the S&P 500 changes by more than three percent from its previous day's closing value.
That's because big changes like that don't happen very often. Going back to January 3, 1950, for the 18,198 days through April 27, 2022 where we have the data to tell how much the index gained or lost from where it ended on the previous day's trading, just 239 involved the index gaining or losing more than 3.00%. That's 1.3% of all the trading days in the index' modern era.
The following chart updates our visualization of that day-to-day volatility, where the dashed red lines roughly coincide with when the S&P 500's volatility has gotten really interesting."
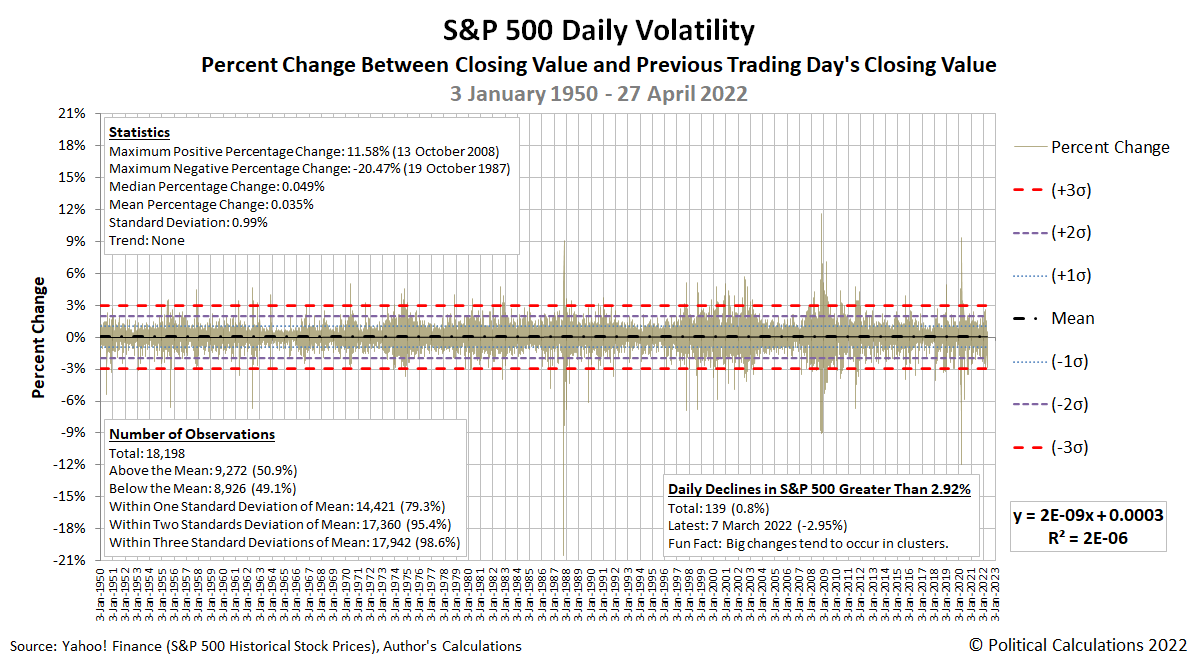
"The index has experienced two trading days in the past week where it has gotten close to becoming really interesting. Friday, 22 April 2022 saw the index fall by 2.77%, while Tuesday, 26 April 2022 saw the S&P drop by 2.81%...Here's the question to answer: How long might it be until what looks like a developing volatility cluster for the S&P 500 causes the index to become really interesting by our standards?"
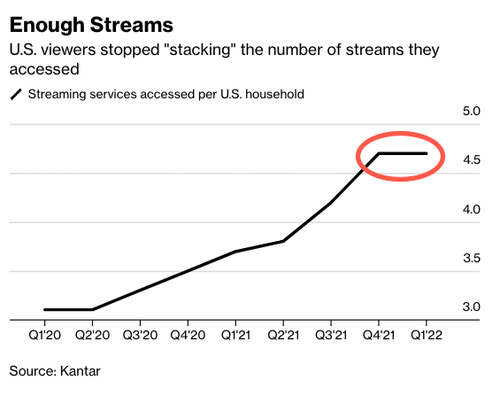
Do the read the article for full details, but contributor Tyler Durden finds strong evidence that US Households Adding Streaming Services Hits Brick Wall.
"Two years of constant increases in the number of on-demand streaming services per American household has come to an end, according to Bloomberg.
A quarterly survey from research company Kantar found the number of on-demand streaming services per household peaked at 4.7. This follows two years of constant increases as new services were being added."
" "Expect to see a greater rate of churn and switching as consumers are more selective about what they watch," Kantar's survey said.
"It may be more challenging for newer entrants in the market, like CNN+, who will have a hard time justifying their value within the already saturated market."
This is more bad news for Netflix, Apple TV, Amazon Prime, Disney+, and other streaming competitors, and it appears oversaturation of services has emerged with the bust of CNN+.
Last week, streaming giant Netflix reported a 200K subscriber loss in 1Q22, the first subscriber decline since 2011. On a larger view, this could suggest the supercycle in streaming may have stalled (for the time being)."
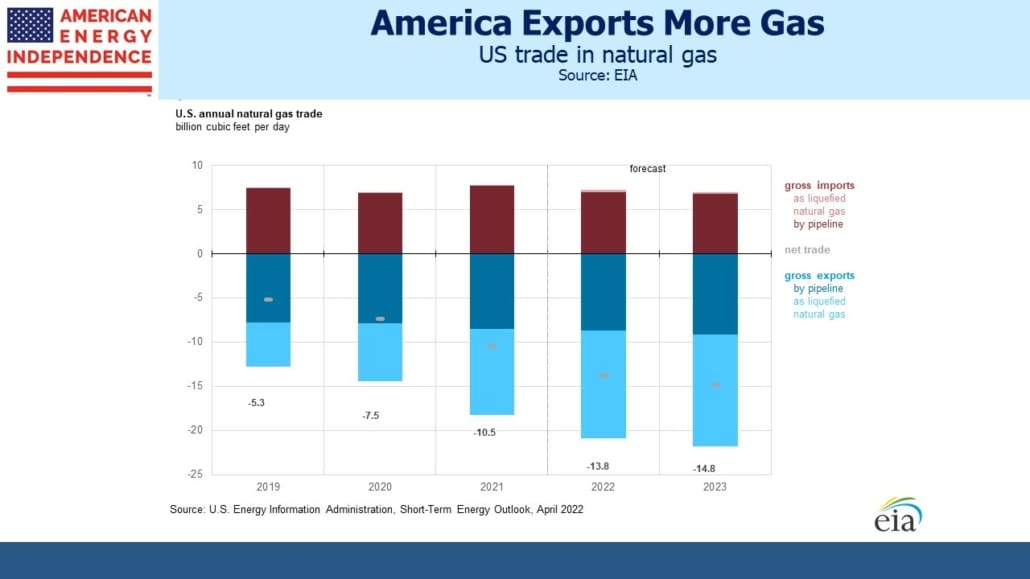
TM contributor Simon Lack who covers energy pipelines and infrastructure writes in a TalkMarkets Editor's Choice piece that with Pipelines — There’s Always A Bull Market Somewhere.
"The US was increasing its net exports of natural gas before Russia’s invasion of Ukraine added an element of urgency. Liquefied Natural Gas (LNG) gets most of the attention, but this year we’ll export nine Billion Cubic Feet per Day (BCF/D) by pipeline, to Mexico and eastern Canada.
LNG exports are still rising, with most global trade directed to Asia. Cheniere, whose Sabine Pass and Corpus Christi terminals export over half the total, often signs flexible contracts that give the buyer (typically a large trading firm like Trafigura) destination flexibility."
See the rest of the article for a rest of the world update by geography and players.
To close out the column today, the Staff of contributor, The Fly, says Here's What Wall Street Experts Are Saying About Twitter Ahead Of Earnings.
"Twitter (TWTR) is scheduled to report results of its first fiscal quarter before the market open on Thursday, April 28. In light of the pending transaction with Tesla (TSLA) CEO Elon Musk, the company will not hold a corresponding conference call."

Below is some of what to watch for:
"USER METRICS: Twitter's monetizable daily active usage, or mDAU, is a closely watched measure of its popularity and growth potential. Last quarter, the company reported global monetizable daily active usage increased 3% sequentially to 217M and 13% year-over-year, while the company's U.S. base rose 2% sequentially to 38M, an increase of 2% year-over-year. “Twitter had a solid fourth quarter to finish 2021, with over $5B in annual revenue, up 37% for the year,” said CFO Ned Segal, at the time. “There are no changes to our goals of 315M average mDAU in Q4 2023 and $7.5B or more revenue in 2023. Our increased focus on performance ads and the SMB opportunity after the sale of MoPub positions us even better for 2022 and beyond.”
AD REVENUE: In Q4, the company reported advertising revenue of $1.41B, up 22% year-over-year. The company also reported total ad engagements dropped 12% year-over-year and cost per engagement increased 39% year-over-year. “Our strong 2021 performance positions us to improve execution and deliver on our 2023 goals," said CEO Parag Agrawal, at the time. "We are more focused and better organized to deliver improved personalization and selection for our audience, partners, and advertisers."
GUIDANCE: Along with Q4 earnings, Twitter guided to Q1 revenue between $1.17B and $1.27B and GAAP operating loss to be between $225M and $175M. Revenue consensus which was $1.26B at the time has dropped to $1.22B."
See the article for more.
With Russia vowing more reprisals as the Ukraine war grinds on, relief efforts continue to be critical.

Please Support Ukrainian Relief
I'll see you next month.


