
As you’ve read in Friday’s intraday Gold & Silver Trading Alert, we just took profits from our previous short positions, and as you know from Friday’s regular (flagship) Gold & Silver Trading Alert, the medium-term outlook for the precious metals sector remains down – it’s extremely bearish for junior mining stocks.
Here’s a quick recap: we entered this short position on May 26, when the GDXJ was trading relatively close to $40. We did that right after we took profits from our previous long position (entered on May 12, which was when we also took profits from the preceding short position). When I sent out the Alert on Friday (Jul 8), the GDXJ was trading at about $31.25.
So, in 28 trading days, you profited on the ~$9 decline in the GDXJ, which was a move lower by over 20% – quite a nice profit for just a bit more than one month.
During the same time, the leveraged proxy for the GDXJ, the JDST, moved from about $9.75 to about $14.37. That’s a gain of about 47%, and that’s on top of a previous gain (preceding long position), which in turn took place right after the previous gain (preceding short position).
Congratulations once again!
OK, what’s next?
While it’s still possible that miners will move lower in the very near term and then correct, I don’t think it’s justified to keep betting on this move at this time. The situation is simply too neutral. Yes, the medium-term factors point to the decline’s continuation. However, there are three important signs pointing to a (short-term!) reversal as well.
The most important indication came from the USD Index.
(Click on image to enlarge)
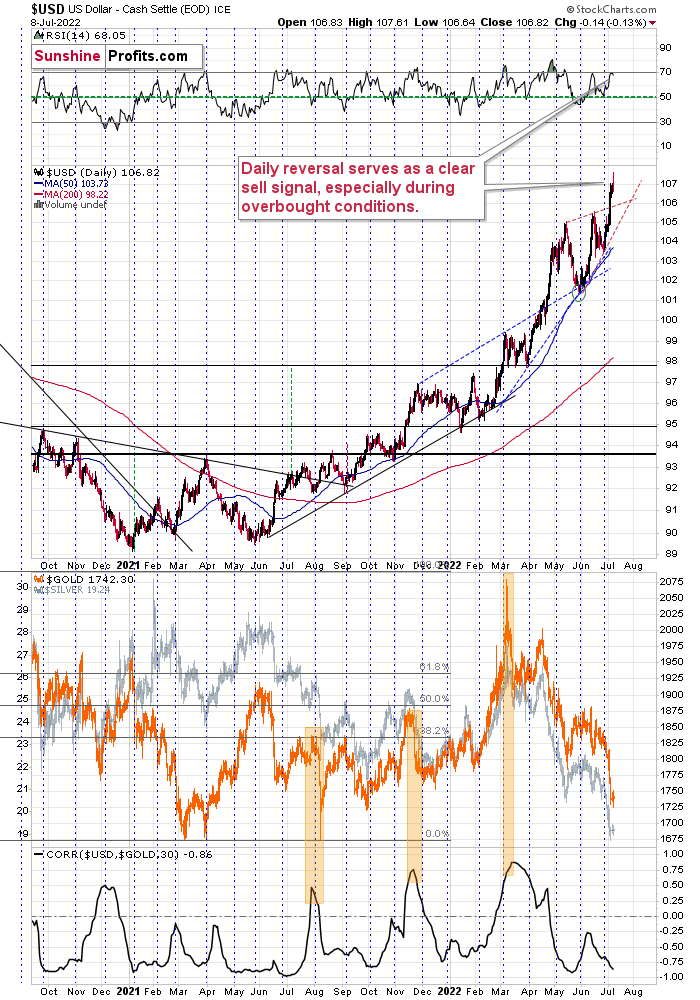
It reversed in a profound manner. I previously wrote that the USDX could rally a bit above 108 and top there, but Friday’s intraday high of 107.61 is “close enough” for me to say that the target was “reached enough”.
You see, at a time when it’s obvious to everyone that a top will take place at a certain level, people (and institutions) place exit orders (and entry orders for short positions) below the topping level, in order to maximize the odds that they will enter the position at all. If enough capital is used for such bets, the top would effectively be formed lower, as those orders are executed.
This might or might not have happened on Friday, but the price was close enough to view this as a possibility. That’s just one thing about Friday’s session that has “caution!” written all over it.
The next, and perhaps most important indication, is the shape of Friday’s candlestick. It was a daily reversal. After an attempt to rally, the USDX reversed and ended the day lower. The USD Index is after a big, sharp upswing, so a correction is expected to happen eventually, and a daily reversal could be all it takes to trigger it.
Finally, the RSI based on the USD Index was just at the 70 level – something that has coincided with local tops in the USD many times in the recent past. For example, that’s what triggered the June correction.
Consequently, we have a situation in which the USD Index could continue to move higher, but it might also correct right away without any additional short-term upswing.
The latter would most likely imply a corrective rally in the precious metals sector.
Wait, wasn’t gold supposed to decline all the way down to its 2021 lows because of the analogy to what happened in 2013?
Yes, that’s what I wrote.
However, I wasn’t very precise in describing the analogy. There was really no reason for me to be very precise because, after all, history tends to rhyme, not repeat itself to the letter.
The question here is, if a corrective rally from Friday’s levels would still be in tune with what happened in 2013, or would it invalidate it. Taking a closer look at what happened in 2013 reveals that it would remain in perfect tune with it. Thus, the link to 2013 doesn’t tell us whether we see a corrective upswing now or after an additional short-term decline. Let’s take a look at gold’s performance from 2013 for more details.
(Click on image to enlarge)
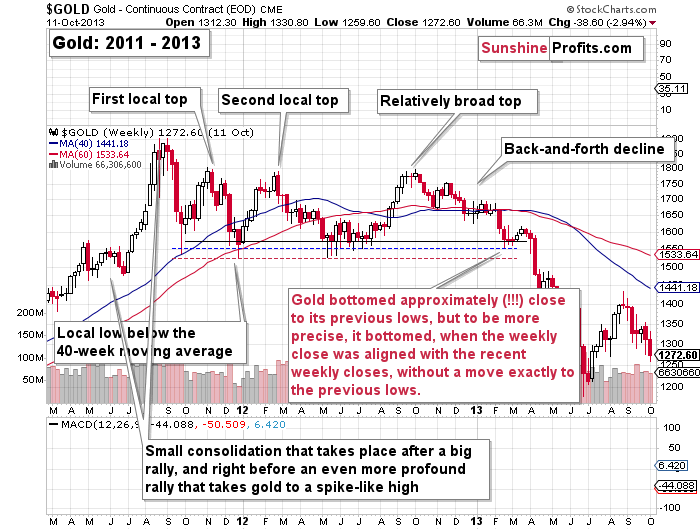
The gold price bottomed approximately (!!!) close to its previous lows. However, to be more precise, it bottomed when the weekly close was aligned with the recent weekly closes, without a move exactly to the previous lows.
What did we just see in gold?
(Click on image to enlarge)
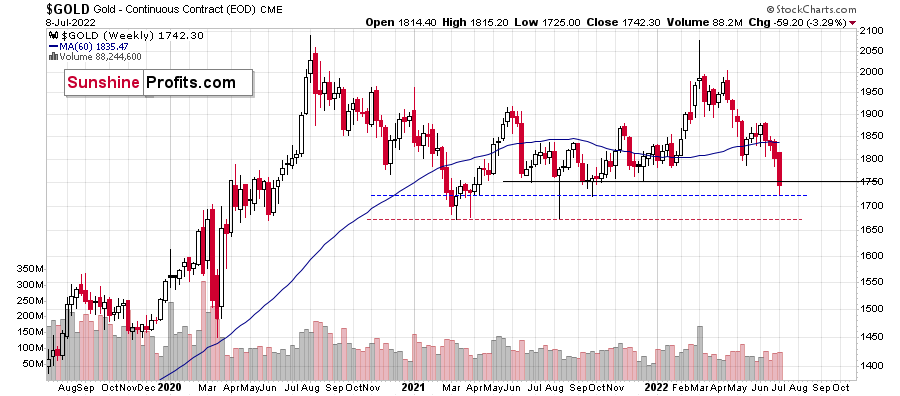
It moved to one of the recent intraweek lows, but on a weekly close basis, it closed very near the previous weekly closes. I marked these levels with solid, black lines on the above charts.
Consequently, we might see a corrective upswing shortly – perhaps as early as this week.
Interestingly, it would perfectly fit the recent head and shoulders formation that could be verified thanks to the correction.
(Click on image to enlarge)
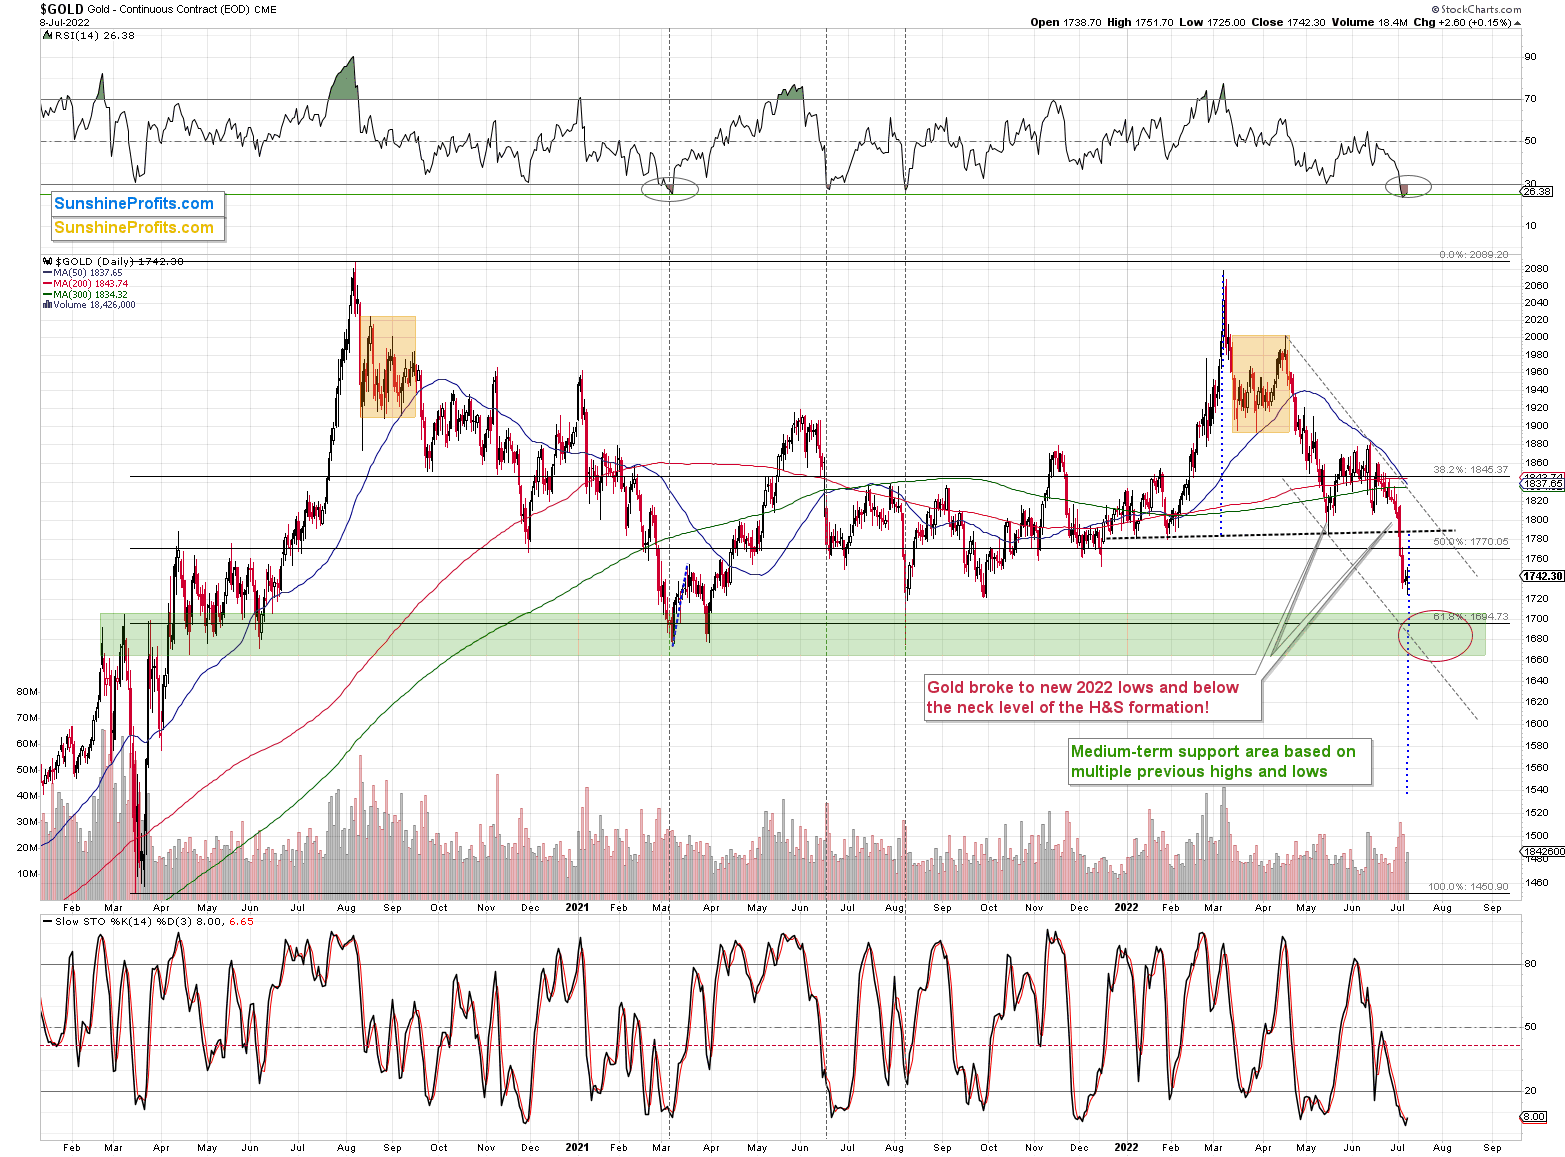
The H&S patterns are often followed by a move back to the neck level, which then – if it holds and serves as resistance – is followed by a decline that’s as big (approximately) as the size of the head of the pattern. If this line doesn’t hold, then it all serves as a gold buy signal.
Based on the indications that I’ve been writing about for weeks/months, the odds strongly favor the continuation of the medium-term decline. This means that it’s likely that the neck level will serve as resistance.
This means that if gold corrects here, I think that the ~$1,790-1,800 area would be the maximum (!) size of the correction. It might not even be as big.
The rally in mining stocks might be smaller still.
The latter would likely depend on the performance of the general stock market, though. If it rallies and gold does too, then juniors would be likely to soar in the very near term. If stocks don’t rally or decline, then the rally in juniors could still take place (based on how oversold they are from the short-term point of view), but it doesn’t have to happen in this case (at least it would not be very highly probable).
An additional “cautionary” signal comes from the silver market.
(Click on image to enlarge)
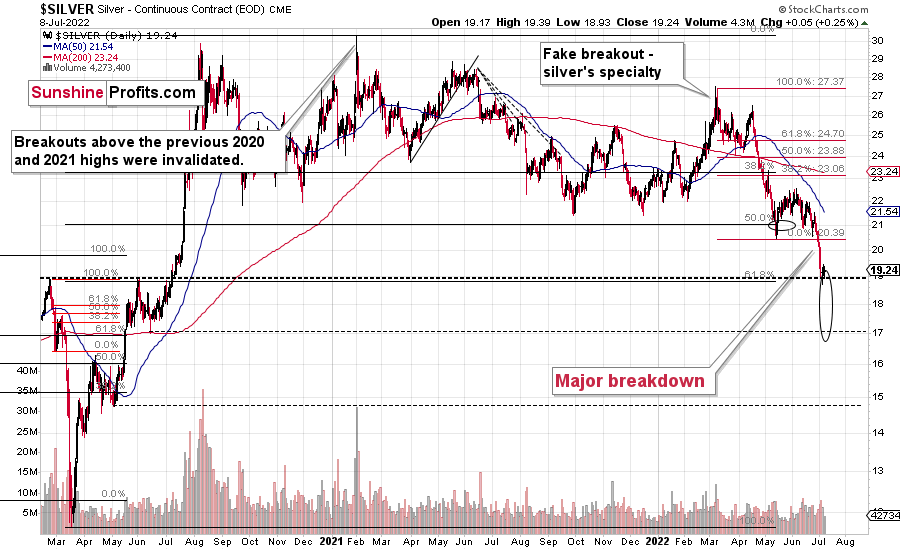
The signal itself is rather straightforward. Namely, silver’s price moved a bit higher after moving to the upper border of its target area that’s based on the early-2020 highs.
In the case of silver, a comeback to the previous 2022 low (at about $20.4) seems like a realistic scenario.
(Click on image to enlarge)
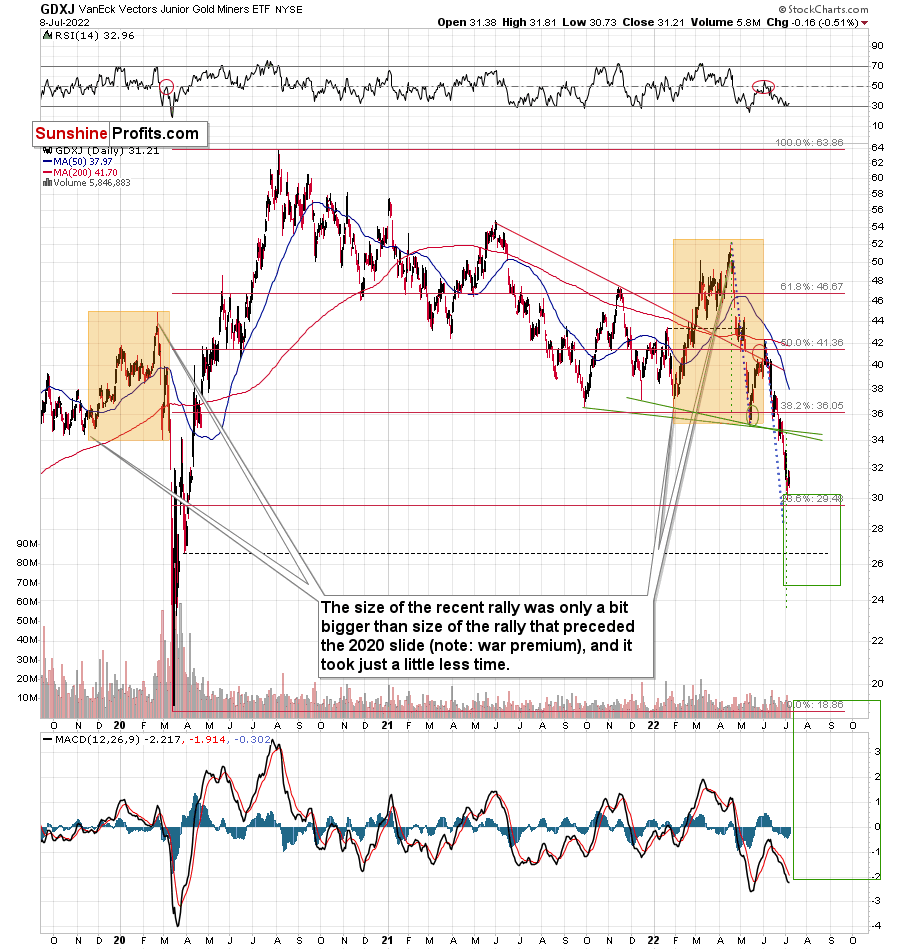
Let’s not forget that junior miners reached the upper part of their target area as well. The support was provided by the psychologically important $30 level and one of the Fibonacci retracement levels.
Based on the above chart, if gold corrects to the neck level of its previously-completed head-and-shoulders pattern, it wouldn’t be surprising to see something similar take place in the GDXJ.
In the case of the junior miners, the neck level (and thus the possible upside target) is slightly above the $34 level, so that’s where the GDXJ could rally. This level is also strengthened by the late-March 2020 top.
Please keep in mind that it could be the case that the GDXJ tops below that, especially if the general stock market declines soon.
So, for now, the old Wall Street saying seems to be the best summary of the short-term outlook and its implications – “when in doubt, stay out.”
More By This Author:
What Needs To Happen For The GDXJ To Hit New Lows?
Gold’s Inability To Pass The $2000 Mark Is A Very Bearish Clue
Gold Stocks’ New Short-Term Lows Can Only Mean One Thing


Comments
Log in or sign up to join the conversation.