
The Relative Price Of Soybeans Vs. Grains, 2014-2019
Reader Ed Hanson insists I plot soybean prices from 2014 onward, instead of 2016, to show how factors other than tariffs affect soybean prices. I am happy to accommodate his request. I wonder why soybean prices suddenly deviate from grains overall, staring in March 2018.
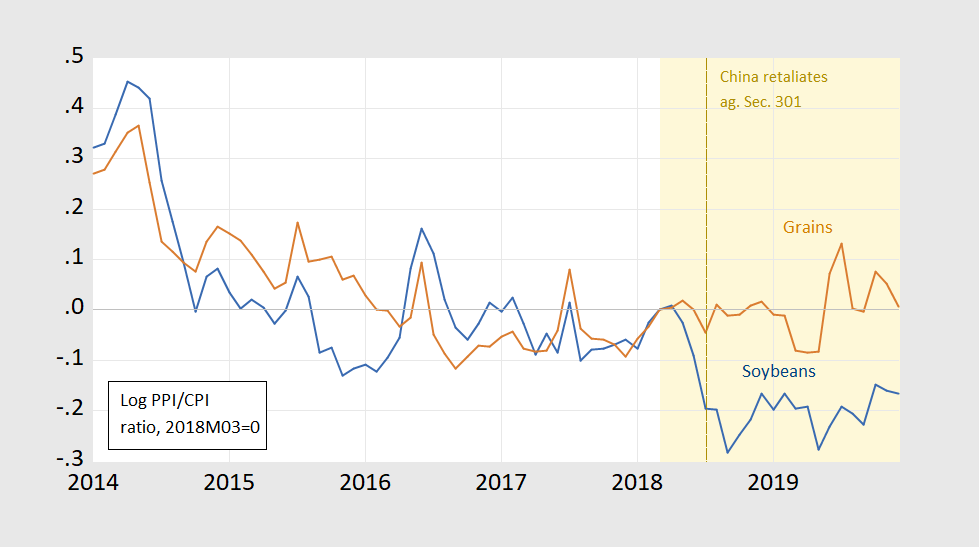
Figure 1: CPI deflated PPI for soybeans (blue) and grains (brown), in logs 2018M03=0. Orange shading denotes period during which China Section 301 action is announced/implemented. Brown dashed line is when Chinese tariffs on US soybeans goes into effect. Source: BLS via FRED, author’s calculations.
I am pretty sure I’ve mentioned the dollar as a determinant of US agricultural export prices, years ago. Indeed, see here (nearly two years ago), inter alia.
What is remarkable is how — while showing all this tremendous price variability — the soybean price deviates starting with the announcement of sanctions against, and retaliation by, the Chinese. Now, of course, like the OMB directive to hold aid to Ukraine 90 minutes after Mr. Trump’s asking “a favor” of the President of Ukraine, it’s all (according to some) a coincidence. But I doubt it.
(Ed Hanson: in the future, before asking for crazily irrelevant plots and/or going on a screed about ρ, could you plot the data on FRED yourself?)
Disclosure: None.


