
The Fed Has Spoken. Are We Seeing Gold’s Demise?
Gold declined profoundly after the FOMC meeting at which the tapering was discussed. Given the $70 drop this week, has the trend changed?
The Fed spoke. The markets reacted. And – as it’s usually the case – the technical indications correctly preceded the news and subsequent market moves.
I started yesterday’s analysis with the following:
The world is holding its breath for today’s comments from the Fed, knowing that one of the approaches would be a game-changer.
If the Fed hints that it’s ready to taper its stimulus, the long-term rates will likely rally, whereas stocks, precious metals, and commodities will likely slide. But if they don’t do that, it seems that whatever has been going on in the above markets will likely continue based on their technical developments.
In the case of gold, it means either a measured late-2012-style decline or a more powerful slide similar to the moves we saw in 2008 and 2020. Which one will it be? Either way, the next big move is likely to be to the downside (even if dovish comments were to spur some immediate-term gains). Why? Because history tends to rhyme, and right now, gold is simply repeating its price patterns from the past that were preceded by relatively similar events (invalidation of the breakout to new all-time highs – just like in 2008; similarity with regard to price moves, volume, and key indicators – just like in 2011-2012).
I will elaborate on this in the following part of today’s analysis, but in short, the Fed indicated that it may raise rates sooner than previously expected in response to strong growth and rising inflationary pressures. And the markets plunged. Furthermore, it seems that it’s just the first crack in a huge bearish dam.
Let’s take a look at the charts.
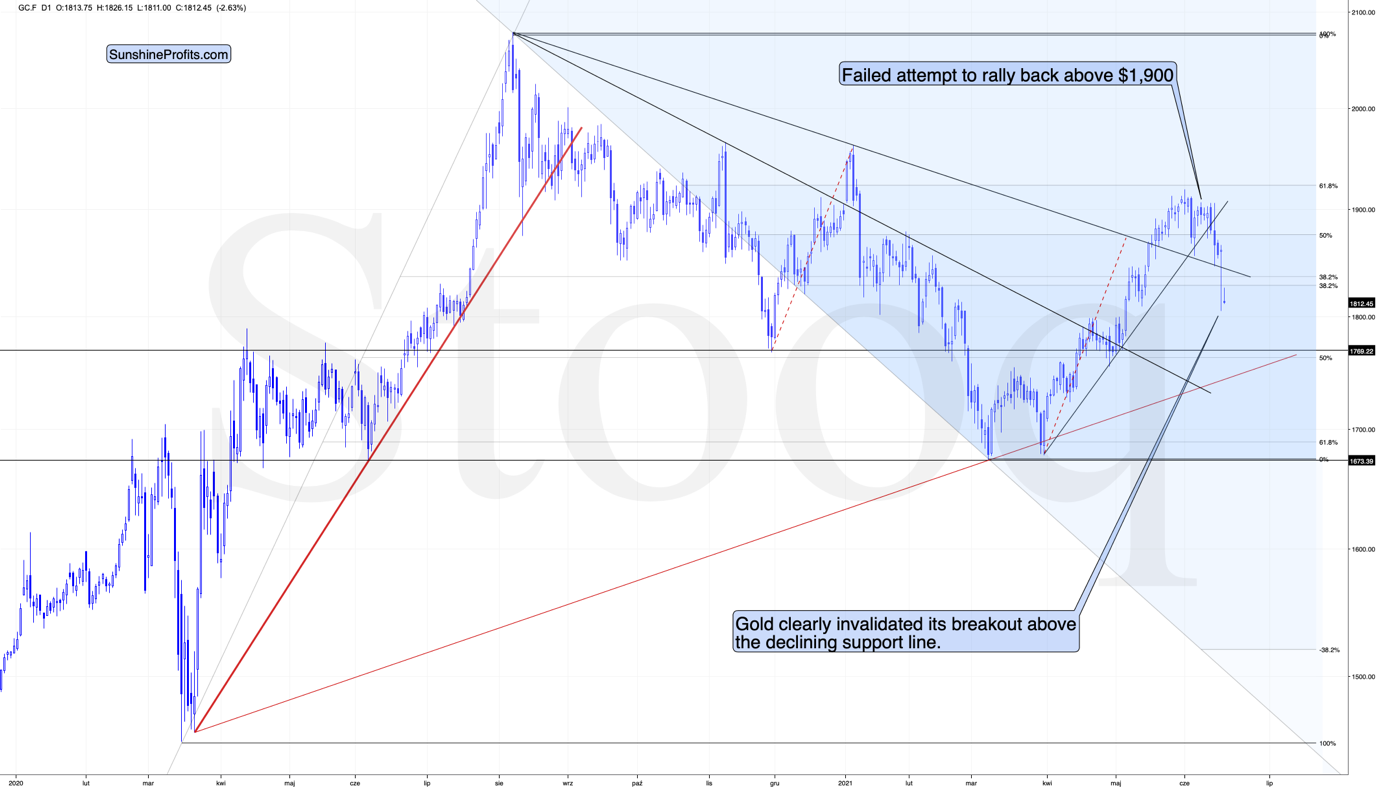
Gold declined profoundly, and it’s now about $70 lower than it was at the beginning of this week. However, the exact number is not that important. What is important, gold broke below not only its rising support line but also its declining medium-term support line (the one based on the 2020 and 2021 highs).
The breakout above this line supposedly was “a proof” of much higher gold prices – at least that’s what the gold bulls were saying. And I disagreed. On a side note, while I didn’t check it myself (well, it’s impossible to read every article out there), based on the correspondence I’m receiving, it appears I’ve been the only one of the more popular authors to be actually bearish on gold at this time. Please keep that in mind, along with me saying that yesterday’s decline is just the beginning.
Sure, gold might correct today or tomorrow, but the trend is now clearly down.
Miners: The Breakdown Is Confirmed
The breakdown in the GDX ETF is also crystal clear. Moreover, it’s now fully confirmed, as the GDX ETF closed below its rising dashed support line for the third day in a row.
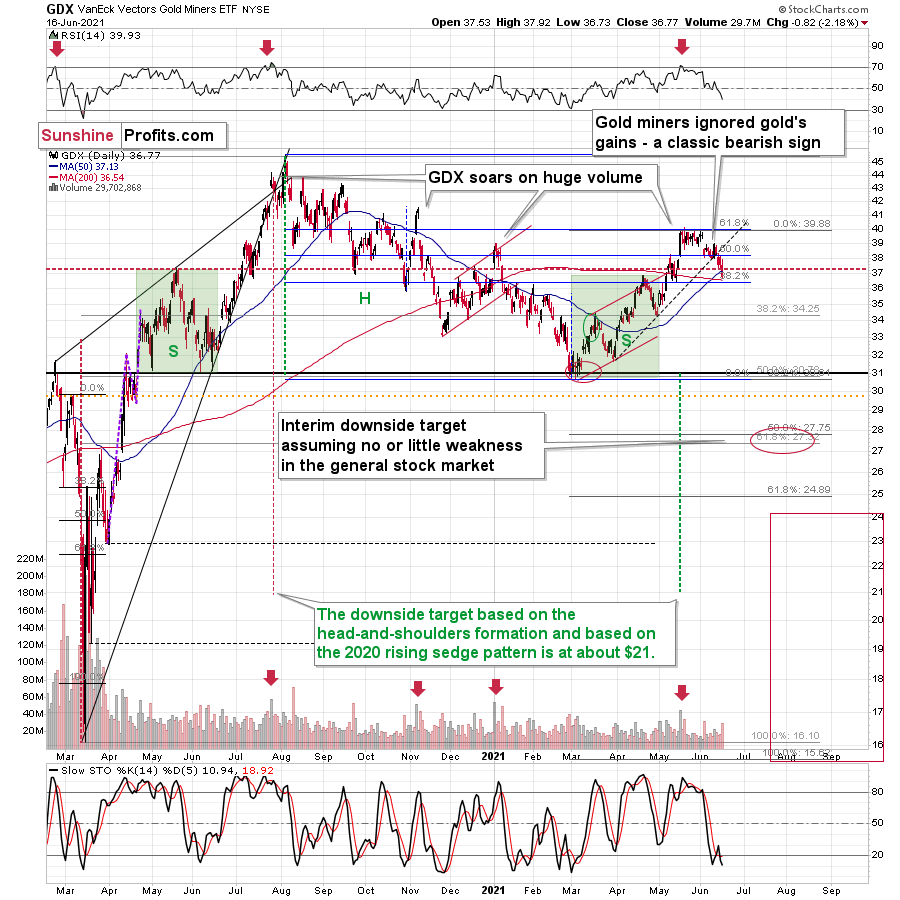
On Tuesday, I wrote that the buy signal from the Stochastic indicator is not to be trusted:
We saw a buy signal from the stochastic indicator, but the breakdown in terms of closing prices is more important, as the buy signals from the stochastic (below 20) were not that reliable so far this year. Please note that the mid-January buy signal was followed by much lower prices in the following weeks. The same was the case with the first buy signal that we saw in late February.
And indeed, the supposedly bullish signal has already been reversed by another sell signal. Thus, the trend remains down and the outlook remains bearish.
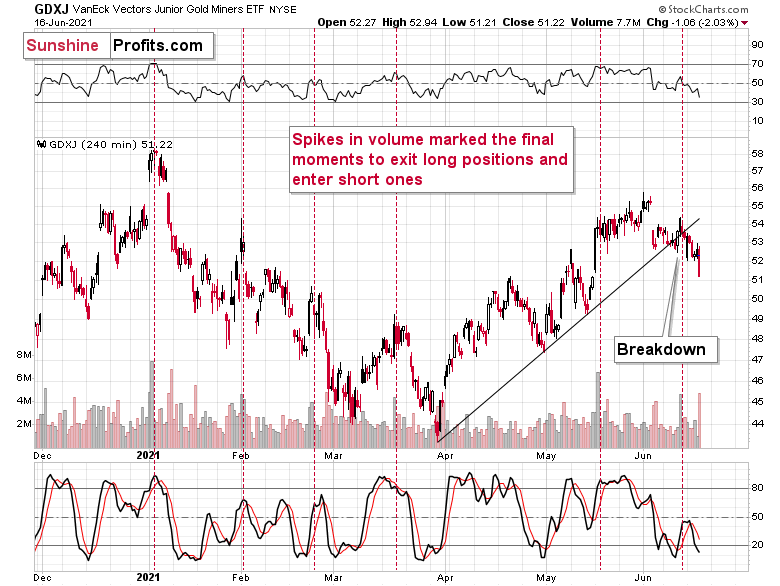
The confirmation of the breakdown is also clear in the case of the 4-hour chart featuring the proxy for junior miners – the GDXJ ETF.
On the above chart, we see that the huge-volume rally has once again worked as a sell signal – in the past, it often heralded short-term declines like the current one.
And speaking of volume and 4-hour charts, let’s circle back to the senior miners – the GDX ETF.
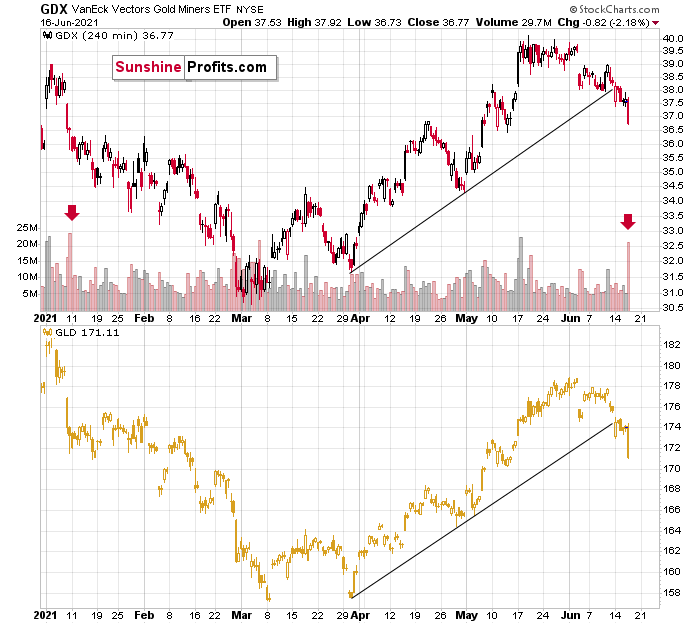
Please note the spike in volume during the final part of yesterday’s session. There was only one time in the recent past when we saw something similar, and that was when gold miners were after a several-week-long rally. It was in early 2021, and it meant that the move lower was not accidental, but rather the beginning of something bigger.
The same seems to be the case now. However, the difference this time is that the markets are repeating a much bigger pattern and the slide is likely to be much greater – just as the long-term HUI Index chart indicates.
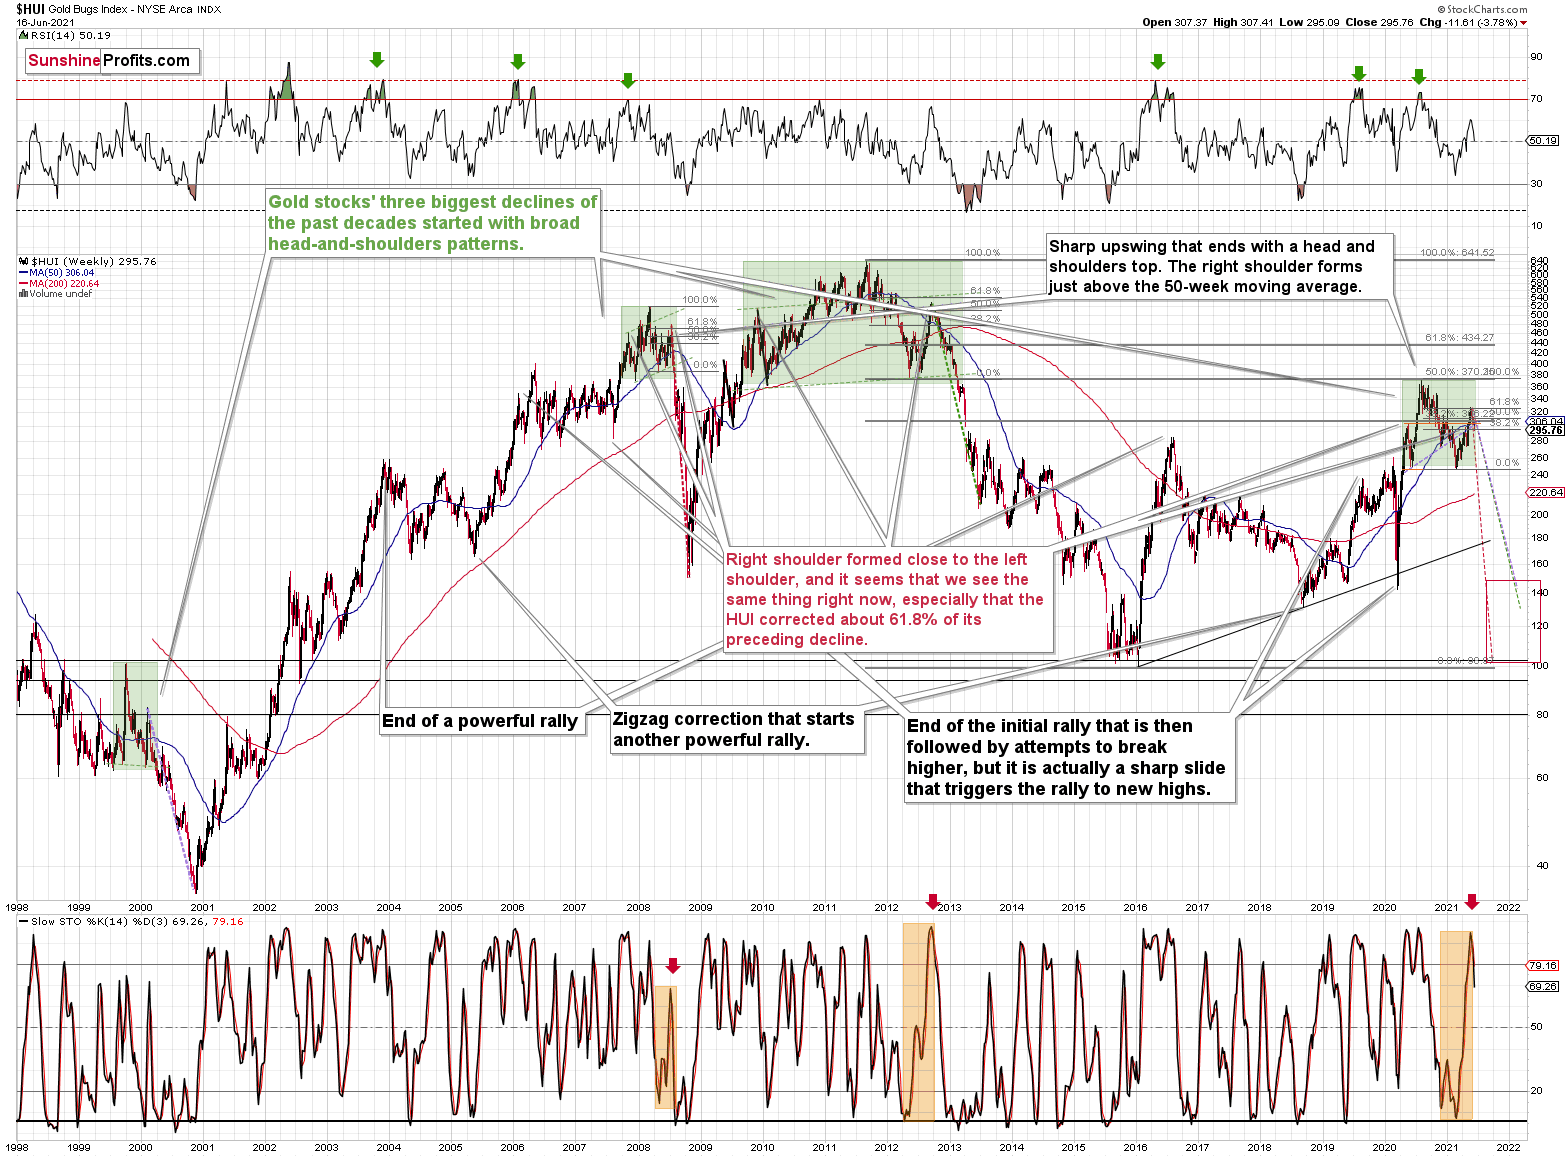
Just as gold, gold miners are repeating their price patterns from 2008 and 2011-2013. And just as I indicated earlier, the sell signal from the Stochastic indicator marked a key turning point – the point after which the biggest part of the decline started.
Once again, what we saw yesterday was likely just the beginning.
The additional factors that confirm this outcome are: the rallying USD Index and an invalidation of the breakout to new highs in the general stock market.
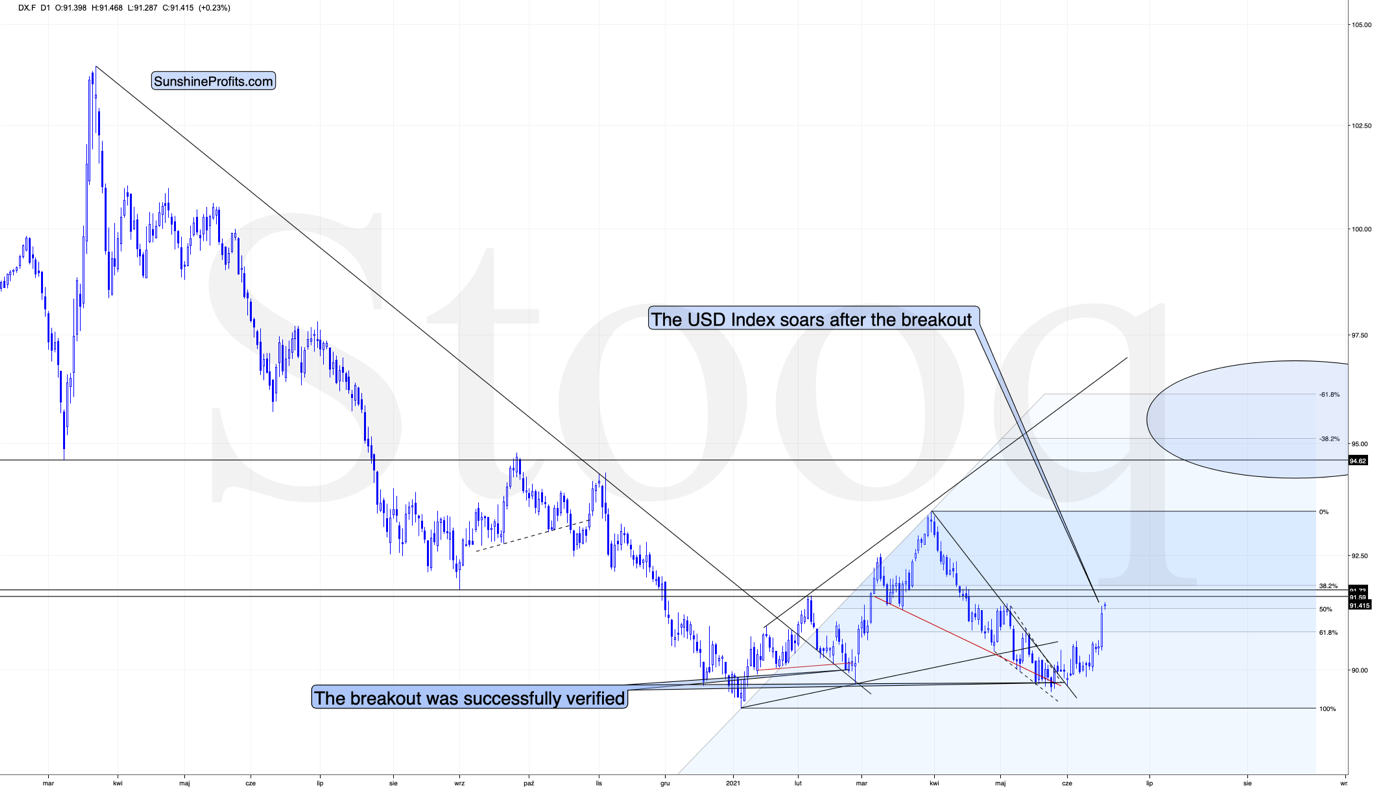
The USD Index soared, and it was perfectly natural for it to do so, given its short- and medium-term breakouts as well as the analogy to 2016.
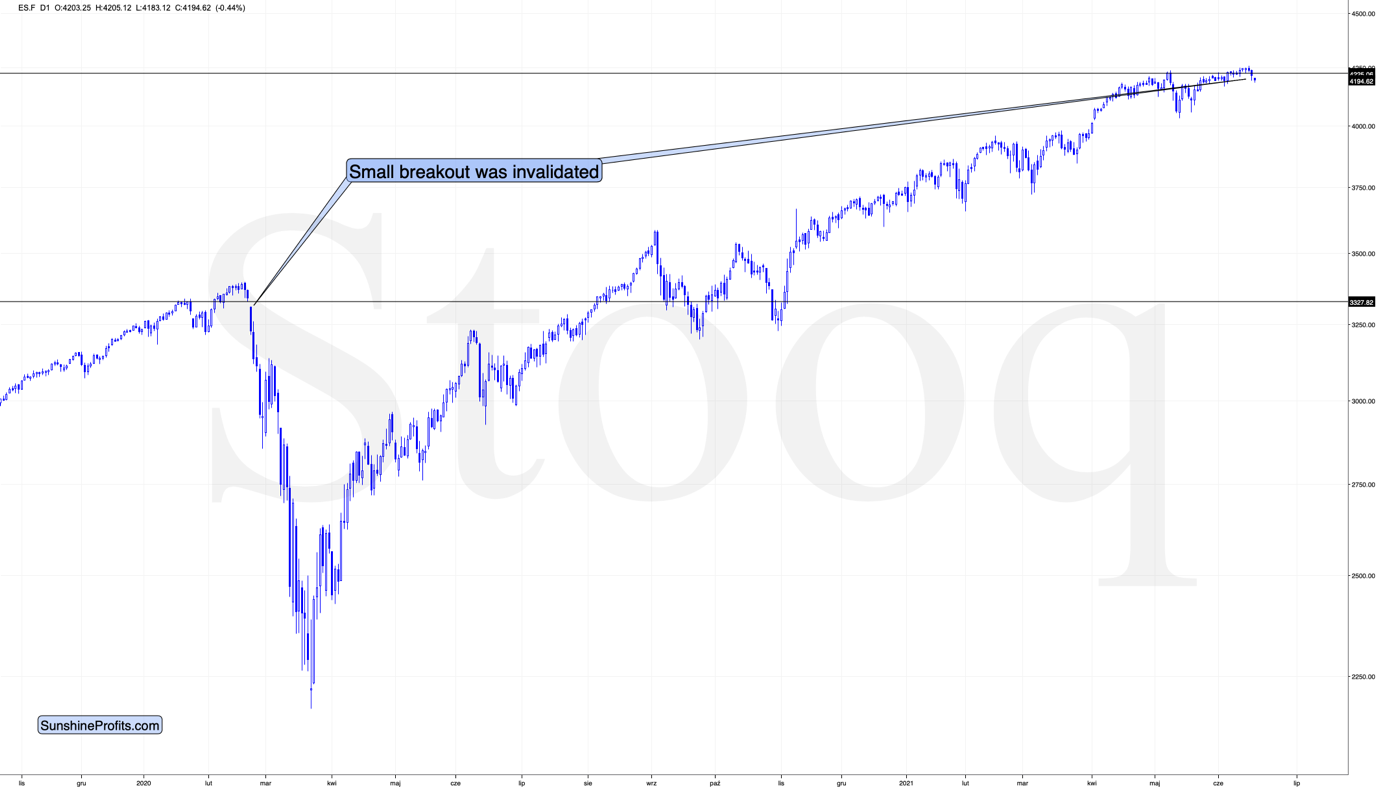
In contrast, the general stock market has just invalidated its breakout to new highs. When the same thing happened in 2020, it started an avalanche of selling, and since history tends to repeat itself, things don’t look good for the stock market at this time.
Disclaimer: All essays, research and information found on the Website represent the analyses and opinions of Mr. Radomski and Sunshine Profits' associates only. As such, it may prove wrong ...
more


The price of gold seems to be directly related to the lack of confidence in the economy.
Fantastic analysis PR! Couldn't resist a smile and hurrah for your tremendously accurate forecast! Well done, and a vindication from being a lonely but accurate bear.