The Bust Continues
By our reckoning, during the first half of 2022 the US economy entered the bust phase of the economic boom-bust cycle caused by monetary inflation (rapid monetary inflation causes a boom that inevitably is followed by a bust as the receding monetary tide exposes the boom-time malinvestments). The bust phase almost always culminates in a recession, although it doesn’t have to.
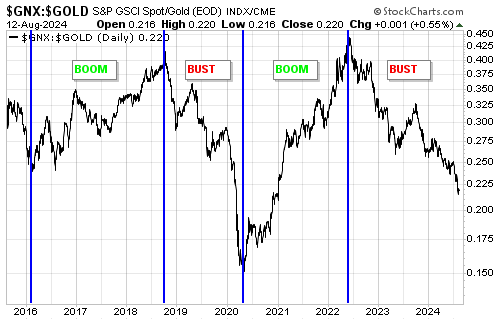
So far, the performances of commodity prices in both US$ terms and gold terms are consistent with an economy in the bust phase, in that last week the GSCI Spot Commodity Index (GNX) tested its cycle low in US$ terms and made a new 3-year low in gold terms. The following daily chart shows GNX in gold terms, that is, it shows the commodity/gold ratio. Booms and busts are defined by the commodity/gold ratio, with booms being multi-year periods during which the commodity/gold ratio trends upward and busts being multi-year periods during which the commodity/gold ratio trends downward.
Note that it is not unusual for the stock market, as represented by the S&P500 Index (SPX), to trend upward for a considerable time after the start of an economic bust. For example, an economic bust started in October of 2018 but the SPX didn’t peak until February of 2020. Therefore, the fact that the SPX made a new all-time high as recently as last month is not inconsistent with the US being in the bust phase of the economic cycle.
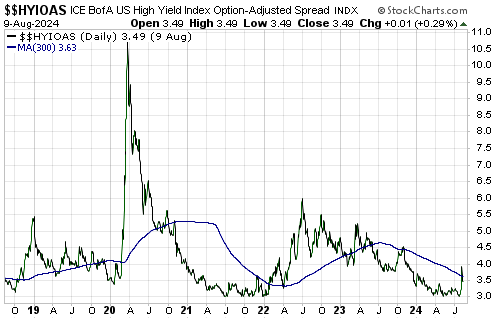
What is inconsistent with the bust phase are credit spreads, which prior to the turmoil of the past 1.5 weeks were at their boom-time lows. However, the relatively low average level of US credit spreads does not mesh with the relatively large number of corporate bankruptcies, so it’s likely that credit spreads are sending a misleading signal.
The misleading signal could be the result of junk-rated corporations delaying their re-financings for as long as possible in the hope that if they wait long enough, they will be able to re-finance at lower interest rates during the next Fed rate-cutting cycle. The problem that many of these companies will encounter is that a Fed rate-cutting cycle probably will begin near the start of a recession and a multi-quarter period during which interest rates fall on high-quality debt while rising rapidly on low-quality debt.
In a blog post earlier this year we wrote that the conflict between the signal from the commodity/gold ratio and the signal from credit spreads would have to be resolved either by credit spreads widening substantially in response to evidence of economic weakness or by the prices of industrial commodities rising substantially in response to evidence that a new boom had been ignited. Our view then and now is that the former is by far the more likely outcome. In fact, there’s a good chance that last week’s rise in the credit-spreads indicator shown on the following daily chart marked an important turning point.
More By This Author:
Has An Age-Old Relationship Changed?
Exploration-Stage Mining Stocks Offer No Leverage To Metal Prices
Commodities Versus Gold


