
Image Source: Pixabay
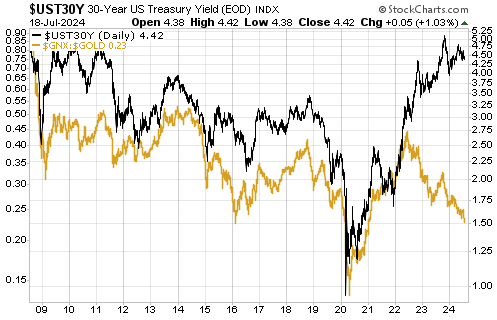
In a blog post in February-2017, we discussed an age-old relationship between interest rates and prices. The following chart-based comparison of the T-Bond yield and the commodity/gold ratio is a pictorial representation of this relationship. At least, it was until about two years ago when a major divergence began to develop between two quantities that previously had been positively correlated. Does this mean that the age-old relationship no longer applies?
The answer is that the age-old relationship hasn’t changed. It can’t change, because it is firmly rooted in economic reality. What’s changed is that the following chart has stopped being a good way to depict the relationship.
The fundamental basis for the underlying relationship is what Keynesians call “Gibson’s Paradox”. We won’t revisit Gibson’s Paradox in this discussion except to point out that it was the name given to the observation that interest rates during the gold standard were highly correlated to wholesale prices but had little correlation to the rate of “inflation”. For a more thorough explanation, please refer to the above-linked blog post.
This excerpt from our blog post explains how the above chart relates to Gibson’s Paradox:
“The commodity/gold ratio is the price of a broad-based basket of commodities in gold terms. In essence, it is a wholesale price index using gold as the monetary measuring stick. Although gold is no longer money in the true meaning of the term (it is no longer the general medium of exchange), it is still primarily held for what can broadly be called ‘monetary purposes’ and in many respects it trades as if it were still money. According to the age-old relationship discussed above and labeled “Gibson’s Paradox” by a confused JM Keynes, the commodity/gold ratio should generally move in the same direction as risk-free interest rates.
The risk-free US interest rate that is least affected by the direct manipulation of the Fed is the yield on the 30-year T-Bond, so what we should see is a positive correlation between the commodity/gold ratio and the T-Bond yield. Or, looking at it from a different angle, what we should see is a positive correlation between the gold/commodity ratio and the T-Bond price. That’s exactly what we do see.”
Well, that was exactly what we WERE seeing until about two years ago when the T-Bond yield began to trend upward in parallel with a downward trend in the commodity/gold ratio.
As stated near the start of this discussion, the age-old relationship between interest rates and prices (“Gibson’s Paradox”) hasn’t changed. Furthermore, the nature of gold hasn’t changed over the past two years, so the commodity/gold ratio still should be positively correlated with the risk-free interest rate, which, in turn, is determined by economy-wide time preference. What has changed is that the T-Bond yield has stopped being a good indicator of the risk-free long-term interest rate.
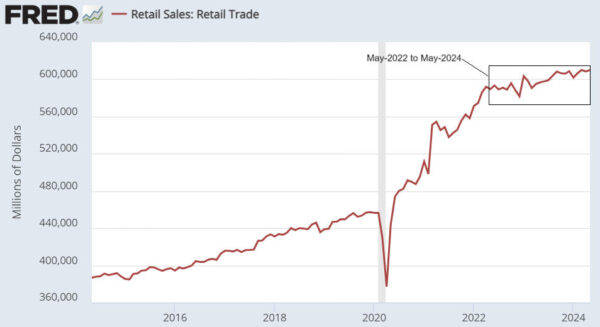
Looking from a different angle, the fact that the commodity/gold ratio has trended downward tells us that societal time preference (the determinant of the risk-free interest rate) has been falling, that is, people are becoming more inclined to save and less inclined to spend. This is a global phenomenon, not a US phenomenon, but evidence in support of this can be found in the following chart of US retail sales. The chart shows that nominal (that is, not inflation-adjusted) US retail sales were only about 3.5% higher in May 2024 than they were two years earlier. Over the same period, the US CPI rose by 7.5%, so in real terms, the dollar value of US retail sales has fallen over the past two years.
The commodity/gold ratio tells us that the risk-free interest rate has fallen since the second quarter of 2022; however, the T-Bond yield is now much higher. This can’t be explained by rising inflation expectations, because the market prices of Treasury Inflation-Protected Securities (TIPS) tell us that inflation expectations have fallen since the second quarter of 2022.
The only way to explain the rise in government bond yields in the face of a falling risk-free interest rate and flat-to-lower inflation expectations is declining confidence in government and/or increasing fear that the rate of growth in the supply of government debt is going to become a major problem in the not-too-distant future. That is, trends in the T-Bond yield no longer reflect trends in the risk-free interest rate due to an expanding risk premium in the T-Bond yield associated with an increasingly profligate government. This, by the way, is one of the reasons why anyone who predicts that Treasury yields are going back to anywhere near their 2020 lows will be wrong.
We now have a market analysis challenge because there is no longer an indicator of the risk-free interest rate that is independent of the gold price. At least, we can’t identify one at the moment. We can use the commodity/gold ratio to provide information regarding the interest rate that underlies all other interest rates, but we don’t have a separate indicator of the risk-free interest rate that can be used to assess whether gold is too expensive or too cheap relative to commodities.
More By This Author:
Exploration-Stage Mining Stocks Offer No Leverage To Metal PricesCommodities Versus Gold
Gold And US Politics


Comments
Log in or sign up to join the conversation.