The 10-Year Treasury Note Is The Canary In The Silver Mine
Fundamentals
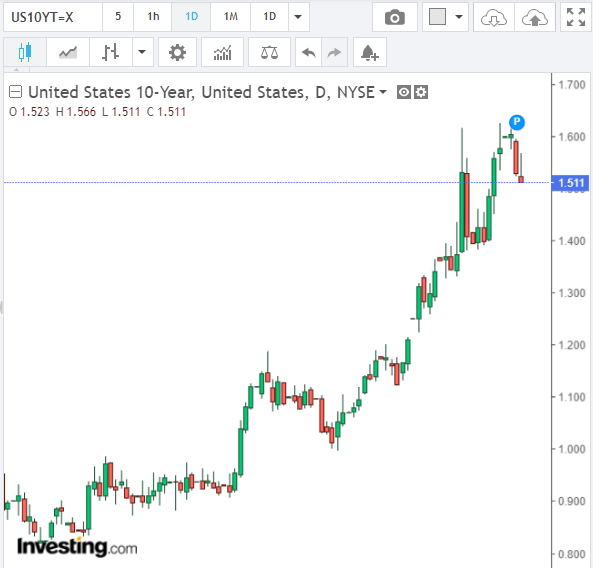
More people are beginning to see how the rise in the 10-year note and increase in interest rates may affect the economy longer term. The 10-year Treasury is at 1.5470. We have come down a little from the recent high, which was causing concern in almost every asset that was leveraged. Most of the economy is highly leveraged, so any rise in interest rates is a major cause of concern.

Silver continues to be difficult to obtain. There's a premium and a wait to get physical silver. The key to the short squeeze in silver is that as the economy opens up again, demand will increase for silver for industrial uses, which will further strain supplies. The supply chain already is stretched, so increased demand should cause prices to rise. Silver also is in demand as a safe haven asset and as an alternative to the US dollar and other fiat currencies.
It's a poor-man’s gold, so far more investors can buy silver than gold, which increases demand and, therefore, the price. We believe that gold and silver are going to see significant increases in price as they become a major alternative as real money compared to the continuously devalued fiat currencies, such as the US dollar.
As the government prints more money, the value of the US dollar continues to plummet in value. The government giving all that money for free means the US dollar is worth less and less. Physical gold and silver have been valued for thousands of years, which also gives them an advantage in terms of risk over Bitcoin.
The pandemic appears to be nearing an end, but the damage to the economy is still staggering. Eight to 10 million people are unemployed. Debt levels are still enormous - getting larger with all the stimulus - and defaults are starting to increase. Interest rates already are rising and prices of basic commodities, such as grains and crude oil, are all rising rapidly.
That is why the 10-year note is rising. Your dollar is going to buy less than it did, and in the future it will buy even less. Gold and silver offer far more stable value than fiat paper currencies. $1,000 silver is possible, especially with new players in the market, such as from Reddit. We are days or weeks away from a major rally in gold.
The Markets
Gold
(Click on image to enlarge)

Courtesy: Ticker Tocker
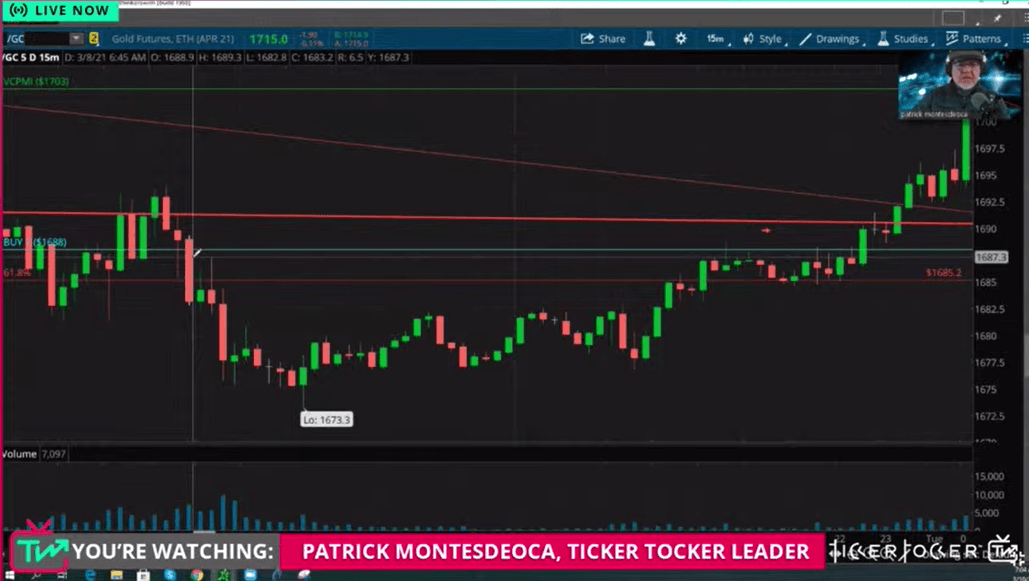
We use our proprietary artificial intelligence in the Variable Changing Price Momentum Indicator (VC PMI) to analyze the markets. Gold hit a low of $1673.30 at about 9:03 am. The market was in an area of accumulation of supply, which led to buyers coming into the market and the price rising again. We do not recommend shorting at such levels, especially if you are building a long-term position.
The odds of the market going down from such a level is only 10% according to the VC PMI. We look for the highest probability trades, so we buy the extreme lows below the mean and sell the extreme highs above the mean based on daily, weekly, monthly and annual means. Nothing is guaranteed, but trading the extremes provides the highest probability trades.
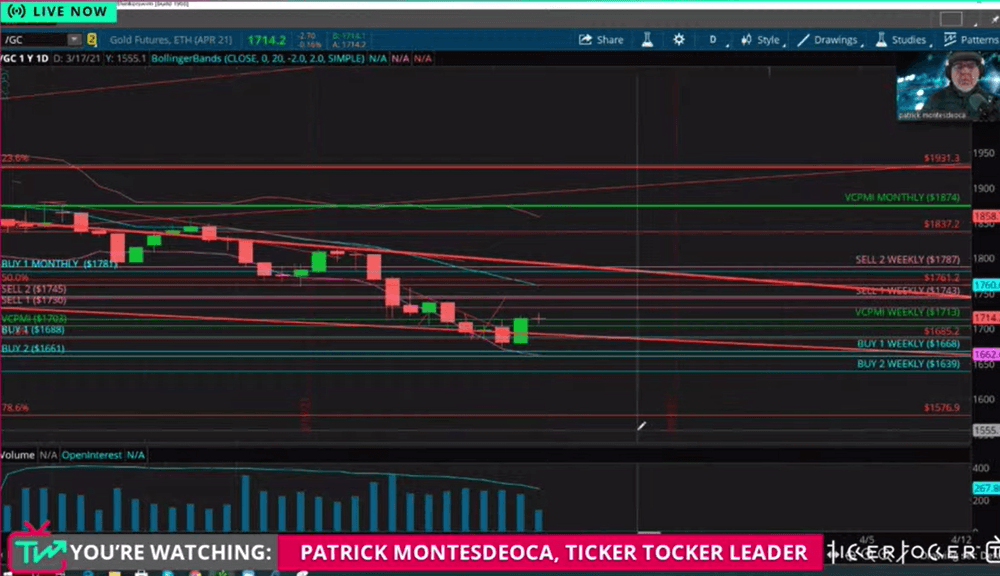
Gold came down below the support trend line in a descending channel, which marked the bottom of that channel. The high was $2089 in August 2020. It has taken an almost 61% Fibonacci retracement to complete this pattern. The market has aligned the price with a number of different indicators that confirm the completion of this correction. There may be a 78.6% retracement down toward $1576, but the uptrend will still be intact, unless it breaks below that $1576 level.
(Click on image to enlarge)

We may have completed this major correction and then we can go aggressively long. It appears that the signal yesterday at $1714 confirmed that we are at the bottom. The monthly Buy 1 level coincides with the nine-year cycle of $1673, which coincides with the Golden Ratio and several other powerful indicators. This area is where you want to get aggressively long on gold. We have maintained our long-term long position during this correction. We have had a drawdown, but we are confident of a long-term increase in gold prices. It looks like the market will test that $1730 level.
Silver
(Click on image to enlarge)

Courtesy: TDAmeritrade
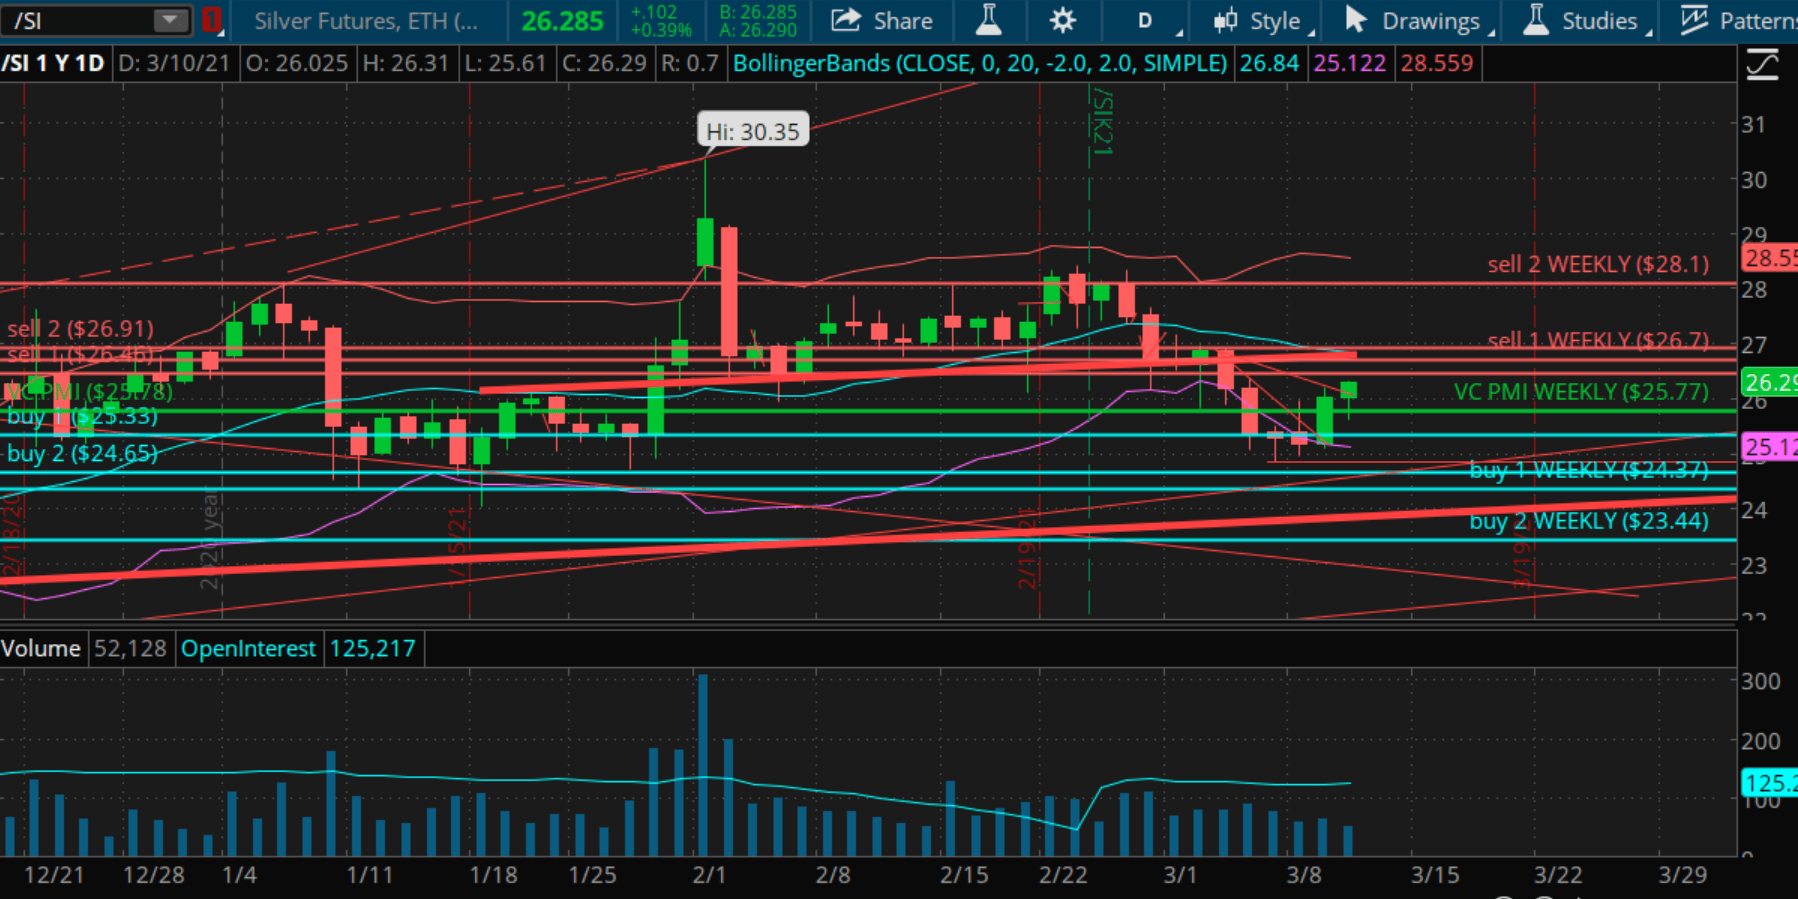
Jan. 31 was the top of silver at about $30.35. Since then, we have reverted and the VC PMI is telling us it's a great time to buy. Silver traded below the VC PMI average price and hit the Buy 1 level of $25.33, which marked the start of the area of support for silver. The VC PMI said not to go short, since there's only a 10% chance of the market continuing down.
The Buy 2 level is $24.65, and from that level there's only a 5% chance the market will continue to move down from there. Both Buy levels are excellent points to enter the market and buy. Silver found buyers and ran up to $25.92, in one day between 6 am and 2 pm on March 2.
We have a daily buy trigger, but also a bullish trend momentum daily and weekly, which is a strong bullish signal. The selling pressure that we saw was overcome by the buying demand. The daily target is $26.46, which is the Sell 1 level. Above it is the weekly Sell level of $26.91. When both signals are activated at the same time, it is a really strong signal.
We can check the VC PMI, in a way, with Bollinger Bands, Fibonacci retracements and other technical analyses, which we overlay on the VC PMI analysis to confirm it.
For day traders, the pattern was completed, so we are now waiting for a new pattern to be detected by the VC PMI.
To learn more about how the VC PMI works and receive weekly reports on the E-mini, gold, and silver, check us out on Ticker ...
more


