
T2108 Update – Bracing Time: Widening Bearish Divergence As Volatility Finds Support
Friday, August 26th, 2016 was the big day so many spent the month waiting to see: Janet Yellen delivered her speech at the annual confab at Jackson Hole, WY. The event did not disappoint in terms of its immediate impact on the market. The day’s range for the S&P 500 (SPY) almost managed to cover the entire range of trading over the last 6 weeks. At the close, the index ended almost exactly where it closed on August 1, 2016.
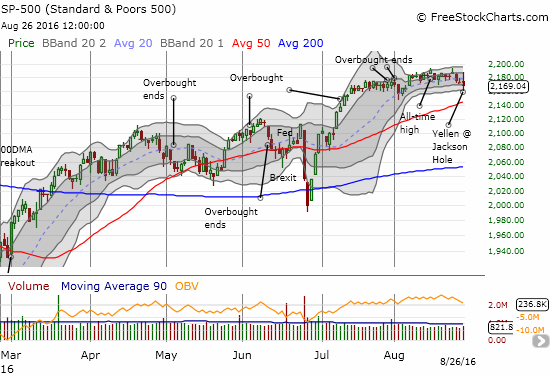
The S&P 500 (SPY) gyrates wildly on its way to a near flat close.
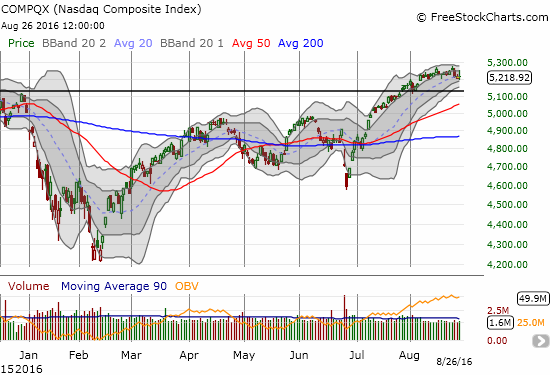
The NASDAQ (QQQ) managed to fight through its wild swings to hold onto the uptrending 20-day moving average (DMA)
The action on T2108, the percentage of stocks trading above their 40-day moving averages (DMAs), was very definitive. My favorite technical indicator concluded its gyration with a notable loss on the day and a 7-week low.

T2108 has been in decline since mid-July even as the S&P 500 printed all-time highs during that time.
The bearish divergence between the S&P 500 and T2108 that I have watched slowly evolve for weeks has taken on a clearly bearish turn. While the S&P 500 churns, T2108 has declined for the last 6 weeks. I think T2108 has confirmed the bearish turn with a close below 60%. Accordingly, I have switched my short-term trading call from neutral to cautiously bearish even though the S&P 500 has not (yet?) broken any important support. This trading call means for new positions I will be more focused on shorting opportunities than on bullish trading opportunities. As a prime example, I went after Caterpillar (CAT) again with put options. CAT is my favorite hedge against bullish positions and one of my first go-to individual stocks when I want to bet against the market in general.
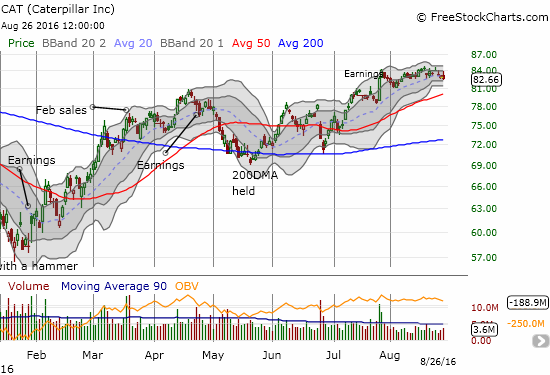
As trading volume sank in August, Caterpillar has not been able to follow-through on its initial post-earnings burst higher.
There is at least one other interesting divergence underway. High beta stocks are out-performing “low volatility” stocks in the S&P 500. In fact, they are moving in exactly opposite directions. I think of this move as a preference for higher risk stocks; a preference I assume is not sustainable when the underpinnings of the market are weakening as demonstrated by the persistent decline in T2108.
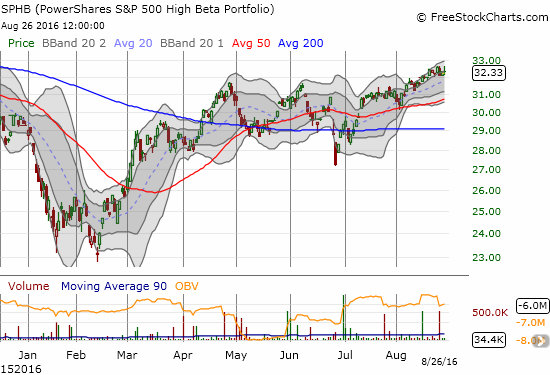
PowerShares S&P 500 High Beta ETF (SPHB) is clinging to an uptrend through its upper Bollinger Bands while printing 52-week highs.
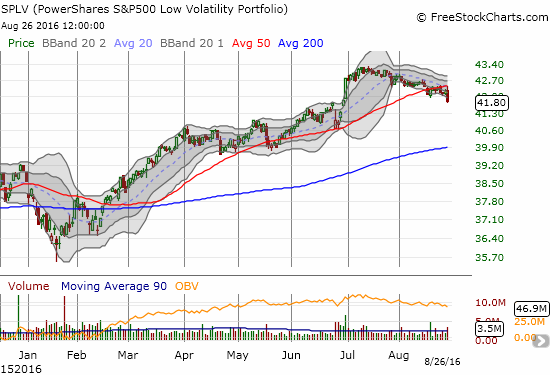
Like T2108, the PowerShares S&P 500 Low Volatility ETF (SPLV) has declined steadily for about 6 weeks.
The volatility index, the VIX, has once again proven the 12 area is a line in the sand and relatively firm support. The VIX showed life last week and on Friday it of course went nuts. The VIX sank to almost 12 ahead of Yellen’s speech, soared to 15 (which is just under the important 15.35 pivot) after the speech was released, and pulled back to 13.8 to close out the week. Like the S&P 500, it closed essentially flat on the day after all that expended energy.
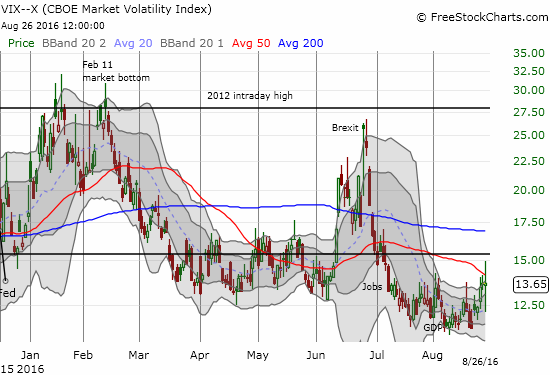
The volatility index erupts with activity.
I am bracing for the VIX to catch its breath and move much higher in September. I am absolutely fascinated at the swell of bets against volatility during the stock market’s most dangerous season. Shorts are practically going parabolic: not a good time for fresh bets against volatility and probably a great time to load up on (put) options which should be relatively cheap.
NEW POST: The ‘Short Vol’ Trade Has Gotten Completely Out Of Handhttps://www.thefelderreport.com/2016/08/26/the-short-vol-trade-has-gotten-completely-out-of-hand/ $VXX $XIV $SVXY
— Jesse Felder (@jessefelder) Aug. 26 at 07:30 AM
The volatility was most evident in currencies. The forex market seemed particularly confused about how to interpret the speech. The U.S. dollar index first popped, sank, and then soared into the close. Given Yellen confirmed the increased odds for an imminent rate hike, the dollar’s strong close was one of the points of action that made sense on the day. The impact of the dollar had ripple effects on other currency pairs, gold (GLD), and silver (SLV). Ahead of the Fed, I tried out a hedged play going long call options on ProShares UltraShort Silver (ZSL) and even more call options on SLV. When the SLV call options doubled in value, I was so tempted to close out the SLV side of the trade. However, I gave this play until the September 16th expiration, and I see big moves ahead. When the dollar fell, I went after a fresh tranche of put options on CurrencyShares Japanese Yen ETF (FXY). THAT play is working out well so far.
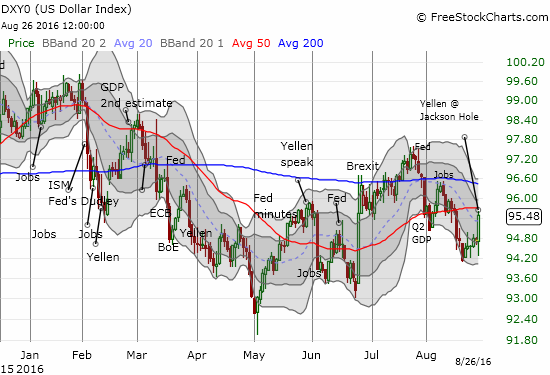
The U.S. dollar index (DXY0) surged back into 50DMA resistance.
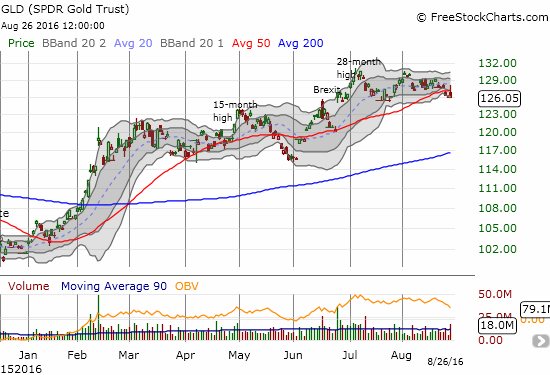
SPDR Gold Shares (GLD) surges above its 50DMA before breaking down again. It’s looking more and more like a top for GLD.
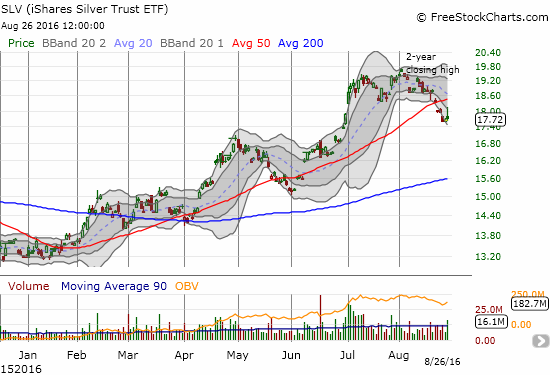
The iShares Silver Trust (SLV) seems to have confirmed its double-top, 50DMA breakdown with Friday’s failed rally.
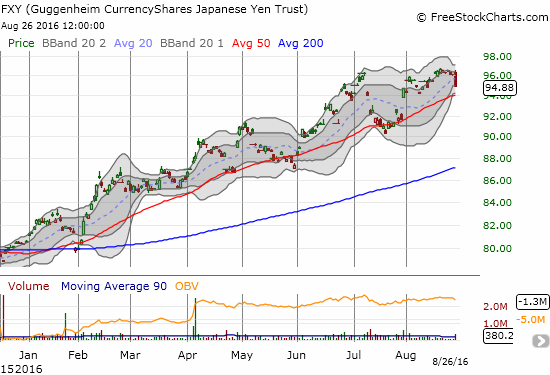
The CurrencyShares Japanese Yen ETF (FXY) lost 1.2% and looks ready for another 50DMA breakdown. Is this finally a top?
In other news, here are some other interesting charts for individual stocks…
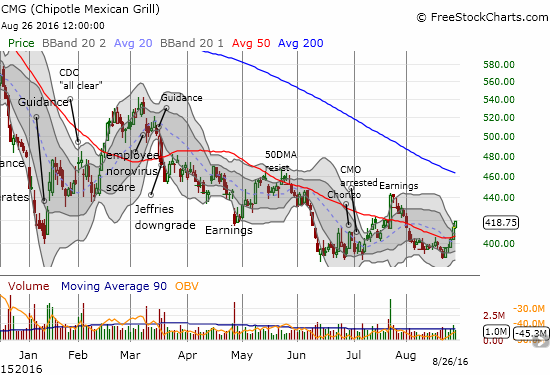
Chipotle Mexican Grill (CMG) managed to print a strong week with a 7.7% gain. Recent history says this move is unsustainable. I am positioned with my typical small number shares versus put options.
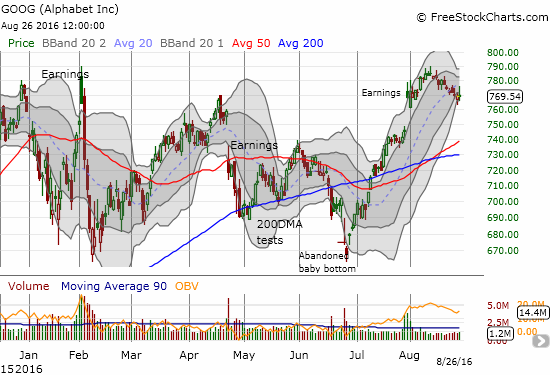
Google (GOOGL) has clearly underperformed the NASDAQ (QQQ) over the last two weeks. A Bollinger Band squeeze may be forming.
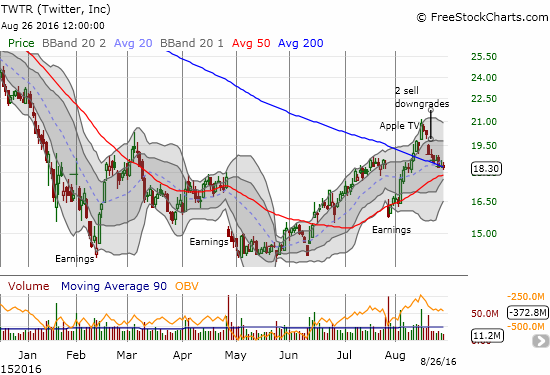
Twitter (TWTR) continues to suffer from the after-effects of two sell ratings. Support at the 200DMA is still holding. The 50DMA is rushing upward to provide additional assistance.

Wynn Resorts (WYNN) failed to generate fresh excitement after rolling out its new Macau plaything. Critical support sits around $87 or $88, but I now need to face the prospect that WYNN is slowly but surely topping with $105 holding as a firm ceiling.
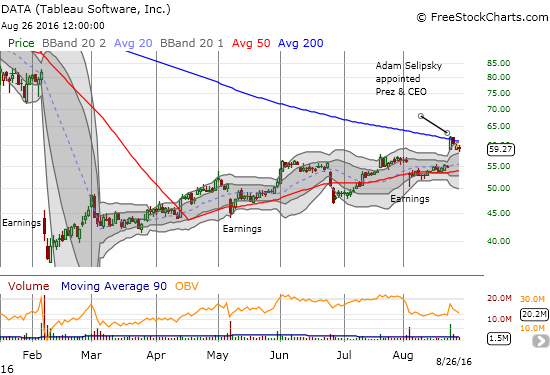
With a single hire, Tableau Software (DATA) surged further into February’s large gap down. Yet, 200DMA resistance holds. This is a make-or-break situation: new high = confirmation of breakout, new post-hire low = likely confirmation of 200DMA resistance.
Daily T2108 vs the S&P 500

Black line: T2108 (measured on the right); Green line: S&P 500 (for comparative purposes)
Red line: T2108 Overbought (70%); Blue line: T2108 Oversold (20%)
Weekly T2108

*
All charts created using freestockcharts.com unless otherwise stated
The charts above are the my LATEST updates independent of the date of this given T2108 post. For my latest T2108 post click here.
(T2108 measures the percentage of stocks trading above their respective 40-day moving averages [DMAs]. It helps to identify extremes in market sentiment that are likely to reverse. To learn more about it, see my T2108 Resource Page. You can follow real-time T2108 commentary on twitter using the #T2108 hashtag. T2108-related trades and other trades are occasionally posted on twitter using the #120trade hashtag. T2107 measures the percentage of stocks trading above their respective 200DMAs)
T2108 Status: 55.9%
T2107 Status: 72.3%
VIX Status: 13.7
General (Short-term) Trading Call: cautiously bearish
Active T2108 periods: Day #134 over 20%, Day #40 over 30%, Day #39 over 40%, Day #38 over 50%, Day #1 under 60% (underperiod, ends 14 days over 60%), Day #16 under 70%
Related links:
The T2108 Resource Page
Full disclosure: lFull disclosure: long SDS, long UVXY shares and ...
more


Thanks for sharing