
Recent articles trumpeting silver's outperformance relative to gold and some ridiculous price projections are a bit too much. Missing from most of the extremely positive commentary is a dose of reality. Below are three charts (source) which should provide some needed perspective. The charts show average monthly closing prices (inflation-adjusted) for the periods August 2020 - July 2024; April 2011 - July 2024; and January 1980 - July 2024. Here is the first chart...
Chart No. 1 Silver Prices (inflation-adjusted) August 2020 - July 2024
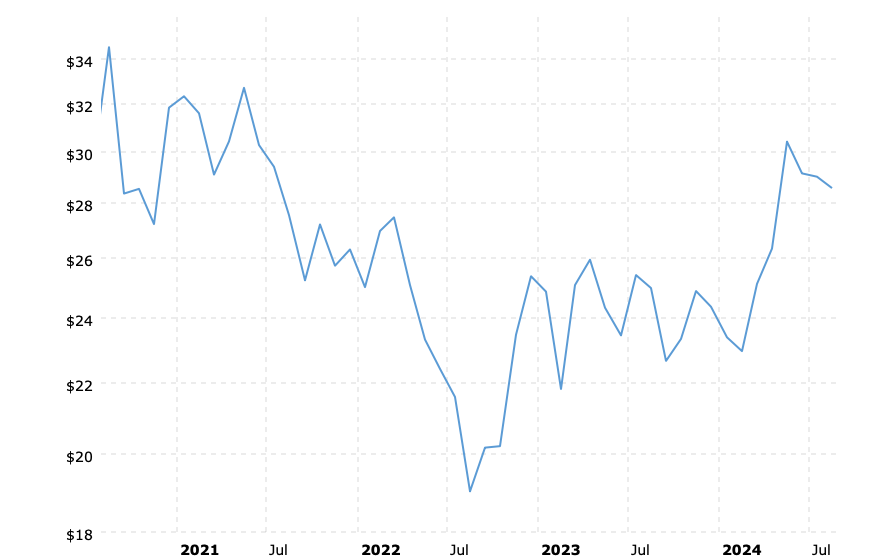
Four years ago, in August 2020, the nominal average closing price for silver was $28.56 oz. For the most recent full month of July 2024, the price was $29.01. The current price is $28.56. Essentially, the silver price is unchanged since its peak four years ago.
The effects of inflation (as shown on the chart) over the past four years result in the equivalent real price of $34.53 for the August 2020 peak. That means that silver, in real terms, is actually down $6.00 oz., or 17%. Those results are fully inclusive of the latest increase in silver from its low of just under $18 oz. in August 2022.
The gold price over that same four years is up 24% compared to the unchanged silver price. On an inflation-adjusted basis, gold is up only 2.3%, but that is still much better than silver's inflation-adjusted loss of 17%.
It is true that silver has outperformed gold since their respective lows in August 2022 and October 2022. Measuring from those points, silver is up 61% compared to gold being up 50%. However, those numbers follow the previous two-year period which saw silver decline by 37% compared to a 17% loss for gold. It is kind of like watching a two-person race wherein one runner falls miserably behind, then runs really fast to catch up but still ends up farther behind than when the race began.
Summing it up, silver has underperformed gold by approximately 20% over the past four years. Silver's underperformance relative to gold recently is nothing new, either. See Chart No. 2 below...
Chart No. 2 Silver Prices (inflation-adjusted) April 2011 - July 2024
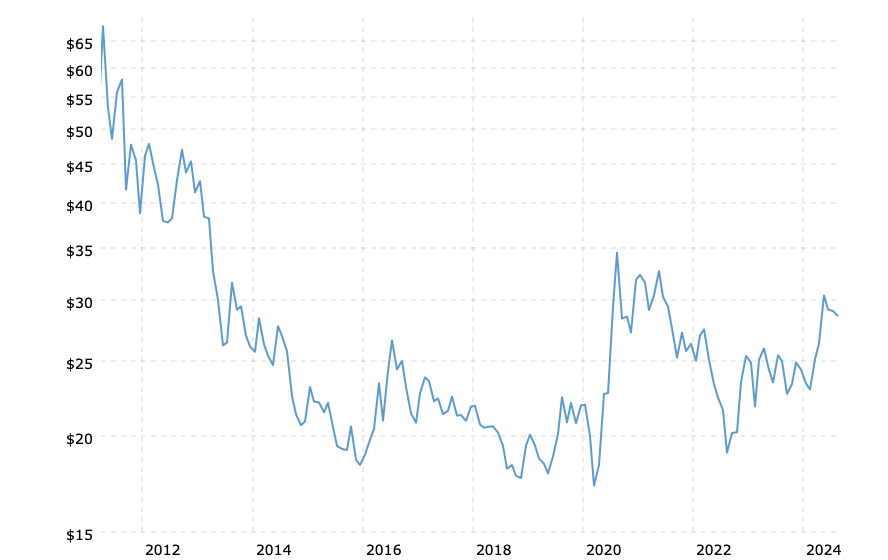
Between April 2011 and July 2024, the price of silver declined by 40% from $48.60 to $29.01. After allowing for the effects of inflation, the loss balloons to 57% ($67.89 down to $29.01).
The gold price since its peak in August 2011 has increased by 34% compared to silver's 40% loss.
Our third and final chart below shows silver prices dating back to 1980...
Chart No. 3 Silver Prices (inflation-adjusted) January 1980 - July 2024
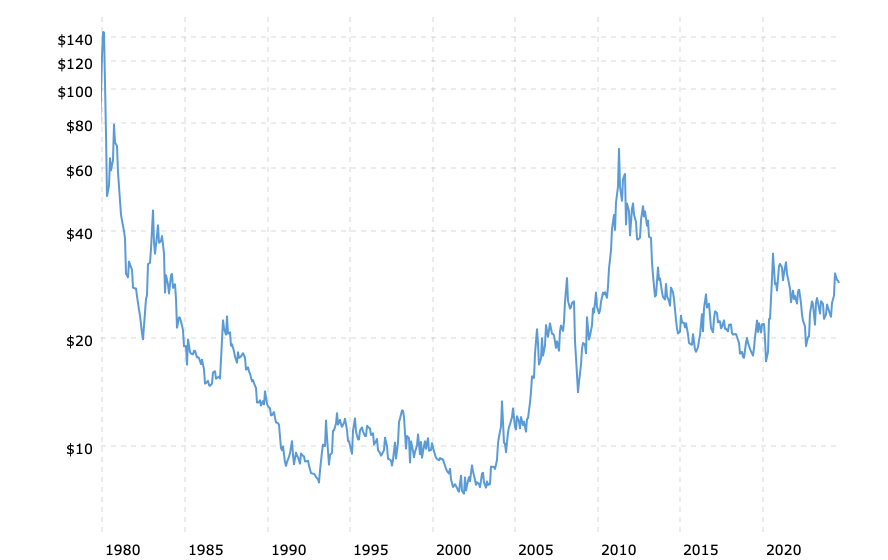
Allowing for the effects of inflation since 1980, the current silver price of $28.56 is lower by 80% compared to its inflation-adjusted price of $144.36 in January 1980. The $144.36 oz. compares to its nominal counterpart of $35.75 oz. If we use the intraday high of $49.45 oz, the inflation-adjusted price is in excess of $190 oz. and the real loss since the 1980 peak is 85%.
Since 1980, the gold price has increased 261% ($677 to $2447) compared to silver's net loss of 20% ($35.75 to $28.56)
CONCLUSION
Silver is cheaper today than it was in 2011 and 1980, both in nominal and real terms. The current price of silver is also cheaper than its inflation-adjusted price in 2020. Here are some points of consideration for stackers and investors...
- Silver is an industrial commodity with a secondary use as money.
- Silver's price is primarily determined by its role as an industrial commodity.
- Silver has little or no value as a long-term investment in its own right.
- Silver should not be considered as an alternative to gold.
- Silver coins can and should be held for potential use in the event of monetary crises.
It is realistic to look for opportunities to trade silver. That is called speculation, and it can be done with pretty much anything which has a market for trade purposes. The potential for some short-term profits, though, does not make silver unique. If you are a trader/speculator, you don't need to justify your actions by talking about "fundamentals".
Also, no matter how wonderful the latest numbers look in the short term, the long-term history of negative silver prices weighs heavily on the current expectations of analysts and investors.(also see Price Of Silver - 100 Years In the Making)
More By This Author:
Bonds, Stocks, Gold & Silver - Volatility On Display
What Happens After A Rate Cut Is Announced?
And So Rates Will Be Higher

Comments
Log in or sign up to join the conversation.