

Image Source: Pixabay
Silver prices are stalling above $36.00 on Monday, with bullish momentum taking a breather after a sharp multi-week rally.
At the time of writing, XAG/USD remains up more than 10% for the month, although the metal now appears to be consolidating as it searches for a fresh directional catalyst.
The US Dollar has lost ground despite the geopolitical backdrop, with its traditional safe-haven status coming under pressure amid political instability and uncertainty over trade policy.
A softer USD has helped keep Silver supported near $36.38, following a modest 0.2% gain from Friday.
The conflict between Israel and Iran, which is on its fourth day, has triggered waves of safe-haven demand. However, signs of a possible diplomatic opening have started to emerge. Reuters and The Wall Street Journal reported that Iran sent messages via Arab intermediaries indicating a willingness to resume nuclear talks with the United States.
This has introduced some hope for de-escalation, limiting further upside in precious metals. However, some Iranian officials have denied these reports.
Additionally, growing speculation around a potential Federal Reserve (Fed) rate cut later this year, particularly ahead of Wednesday’s FOMC meeting, further enhanced Silver’s appeal as a non-yielding hedge asset, helping it hold elevated levels despite fluctuating risk sentiment tied to the Middle East conflict.
Silver technical analysis: XAG/USD holds firm above $36.00
Silver (XAG/USD) is trading near $36.38 on Monday, holding firm after a strong rally through June.
Last week’s breakout cleared long-term resistance at the October 2012 high of $35.92, which now acts as immediate support.
Price action is showing signs of consolidation below the year-to-date high of $36.89, posted last Monday.
Silver (XAG/USD) daily chart
(Click on image to enlarge)
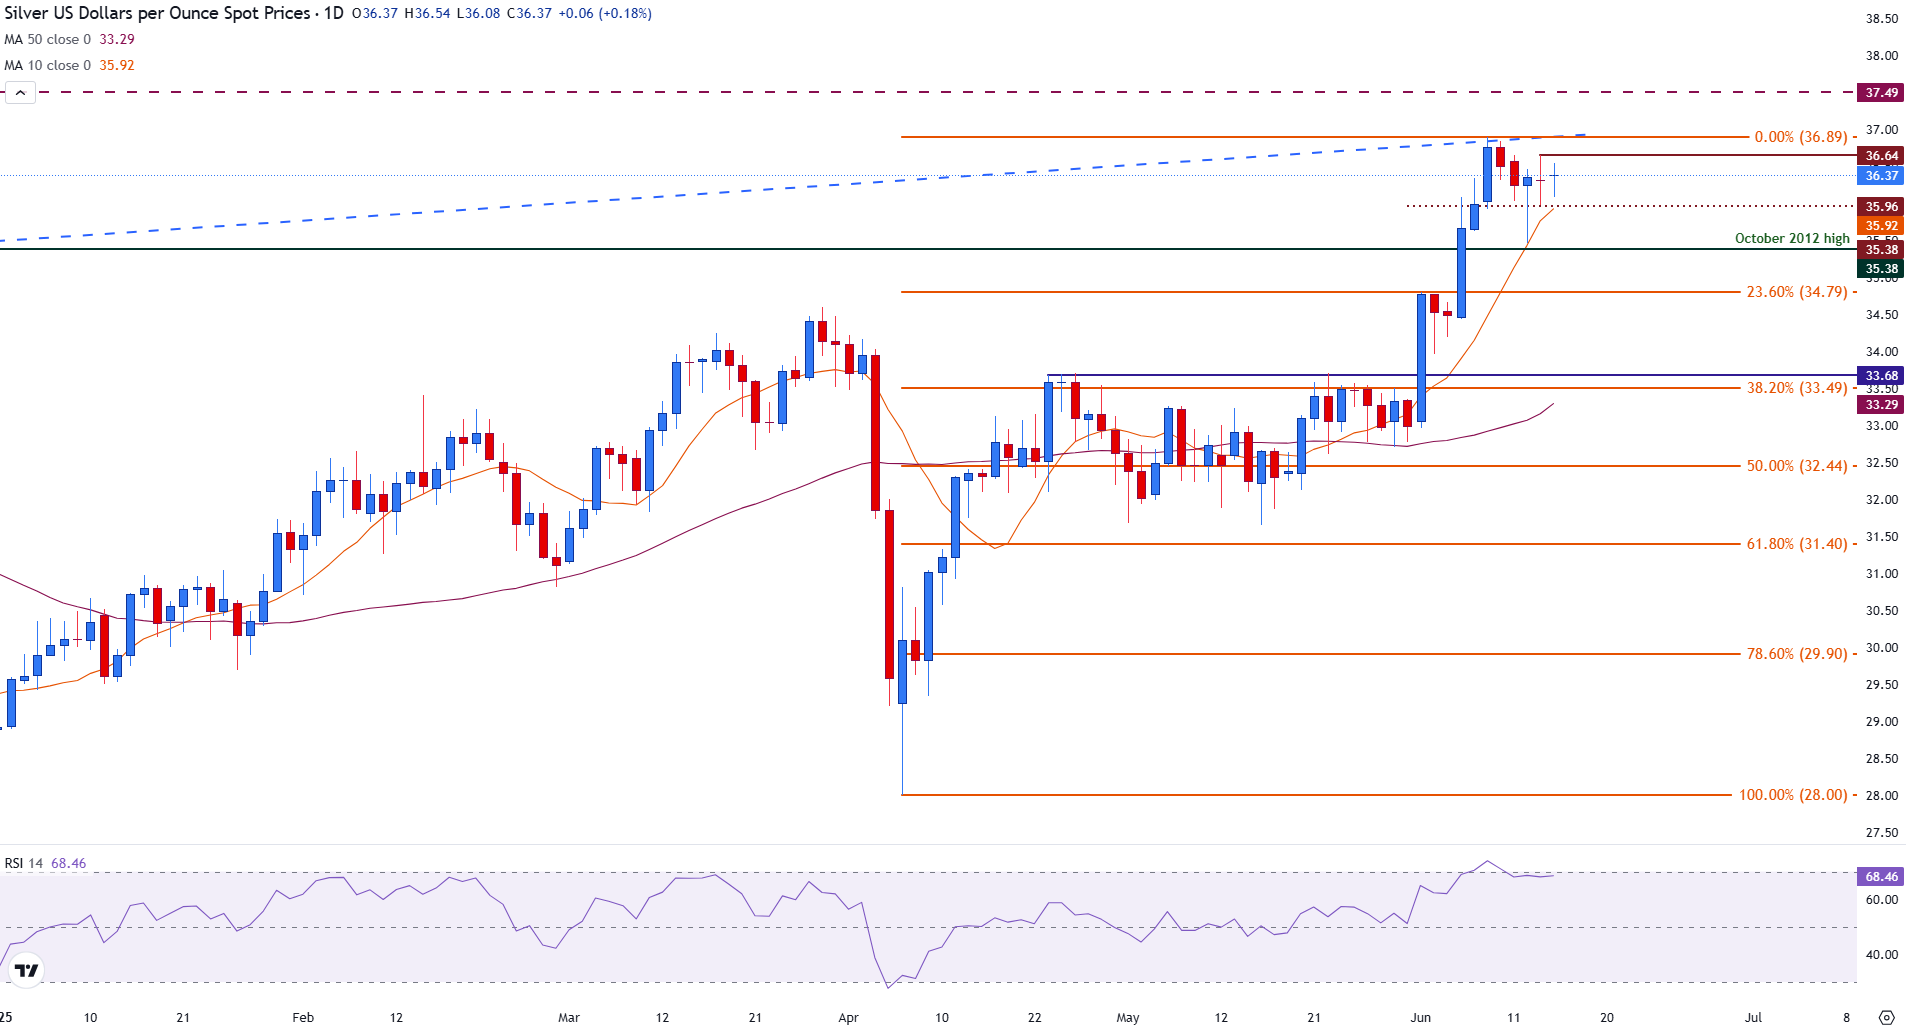
The daily Relative Strength Index (RSI) remains elevated at 68, suggesting bullish momentum is still in play but nearing overbought territory. A sustained break above $36.89 could pave the way for a move toward long-term resistance at $37.49.
Conversely, a drop below $35.92 would expose downside risks, with the next key support level seen at $34.79 and the 38.2% Fibonacci retracement at $33.68, which is closely aligned with the 50-day Simple Moving Average (SMA).
More By This Author:
Oil Price Forecast: WTI Eases As Markets Eye Israel-Iran Conflict, Hopes For De-Escalation
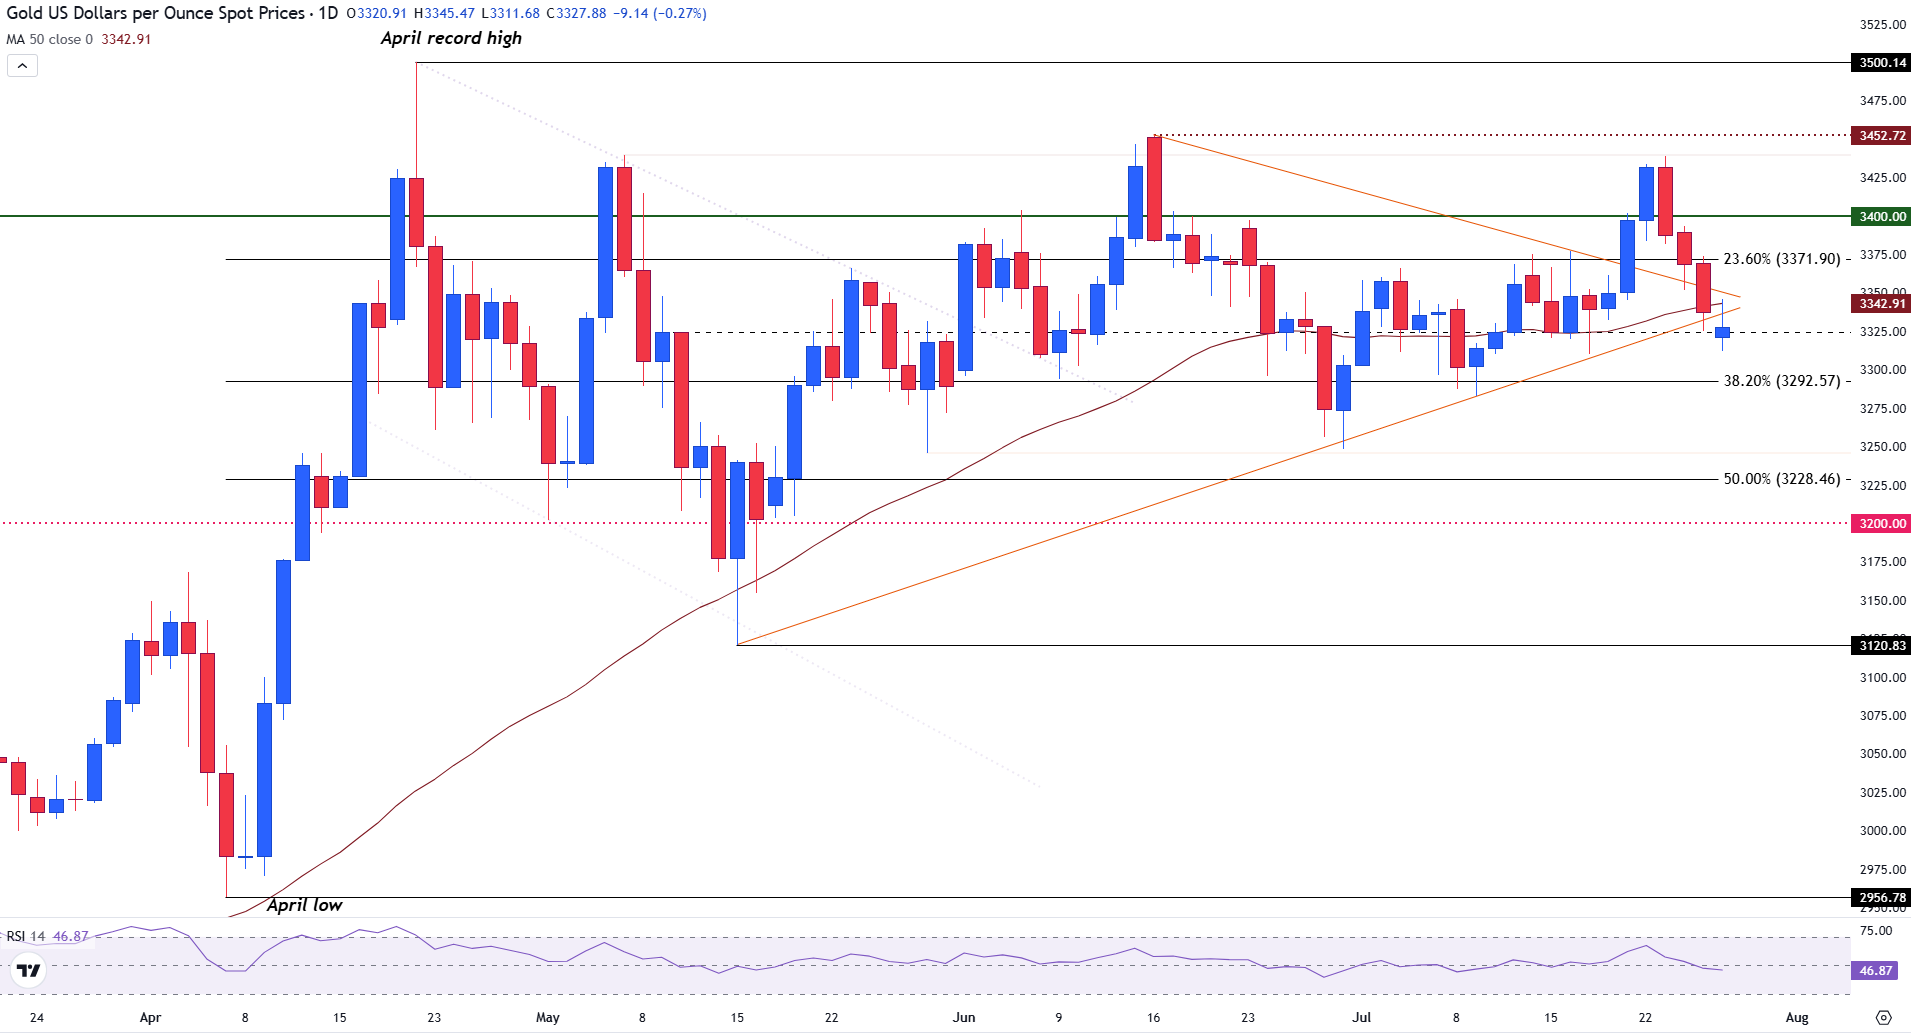
Gold Eases After Hitting A Two-Month High Amid Escalating Israel-Iran Hostilities
Oil Price Forecast: WTI Rallies To $74 Before Settling Above $72


Comments
Log in or sign up to join the conversation.