
- Gold reaches a two-month high at $3,452 but retreats afterwards as traders take profits.
- Markets remain focused on the Israel-Iran conflict and rising global geopolitical risks.
- The US Dollar (USD) is experiencing a slight boost from a rise in 10-year and 30-year Treasury yields ahead of Wednesday’s Fed Meeting.
Gold (XAU/USD) is experiencing a mild pullback during the European session after reaching a two-month high of $3,452.72 in the Asian session on Monday.
Geopolitical tensions, especially the conflict between Israel and Iran, have contributed to supporting Gold prices. However, after peaking, XAU/USD pulled back, trading above $3,400 at the time of writing.
The main drivers of Gold prices so far have been their safe-haven appeal, movements in US 10-year Treasury yields, and profit-taking at higher levels.
Tensions between Israel and Iran have escalated over the weekend and are entering the fourth day of fighting with no signs of easing. The international community, including the United Nations (UN), Saudi Arabia, and the US, has called for calm and urged de-escalation.
Daily digest market movers: Gold remains supported by Israel-Iran conflict
- Israel’s attack on Iran has targeted military and nuclear sites. The so-called “Operation Rising Lion” was launched by Israeli leadership on Thursday evening and has resulted in the deaths of Iranian military leaders, scientists, and civilians.
- The International Atomic Energy Agency (IAEA) reported on the attacks on Friday. The recent statement indicates that a few facilities have been damaged in Iran so far. The Natanz enrichment facility has sustained significant damage. The Isfahan (Esfahan) Nuclear Technology Center was also targeted, resulting in damage to the uranium metal production facilities.
- Iran’s health ministry has reported that the death toll is currently at 224. According to CNN, Israel’s death toll has currently been reported at 24. Both countries have broadened the scope of the attacks as the conflict enters its fourth day.
- The United States will hold a 20-year Bond Auction during the American session at 17:00 GMT. The auction will test the bond market after concerns about US debt sustainability have increased. The bond yield in the latest such auction – the interest rate a holder receives for investing in a bond – stood at 5.047%, the highest level since October 2023. Yields have an influence on the US Dollar’s valuation as higher bond yields can attract investment into the US Dollar, thus putting pressure on Gold prices.
- The Federal Reserve (Fed) will announce its interest rate decision on Wednesday. Investors broadly expect the Fed to maintain rates at the current range of 4.25%-4.50%.
- The Federal Reserve Open Market Committee (FOMC) Meeting will be closely monitored, as will the Fed Press Conference and the Summary of Economic Projections (popularly known as the dot plot). These events will provide insight into the economic risks and factors that the Fed is watching, which will be delivered by Fed Chair Jerome Powell. The focus will be on the projected forecast on the interest rate trajectory and the outlook for the US given the current conditions.
Gold technical analysis: XAU/USD eases back from $3,450
Gold prices are edging lower, trading near $3,415 at the time of writing on Monday. However, the 4-hour chart shows that losses have been limited. After reaching a peak of $3,452 earlier in the day, a combination of profit-taking and technical support has limited the XAU/USD range.
The immediate upside hurdle emerges at around $3,439, which marked the monthly high in May. The next level of resistance for the short-term move sits at $3,446, which came into play on Friday, and the daily high at $3,452. A break of this level could result in a retest of the $3,500 record high set in April.
On the downside, initial support lies at the psychological level of $3,400, which aligns with the 20-period Simple Moving Average (SMA) on the 4-hour chart. The 23.6% Fibonacci retracement of the April move sits at $3,372.
Gold (XAU/USD) 4-hour chart
(Click on image to enlarge)
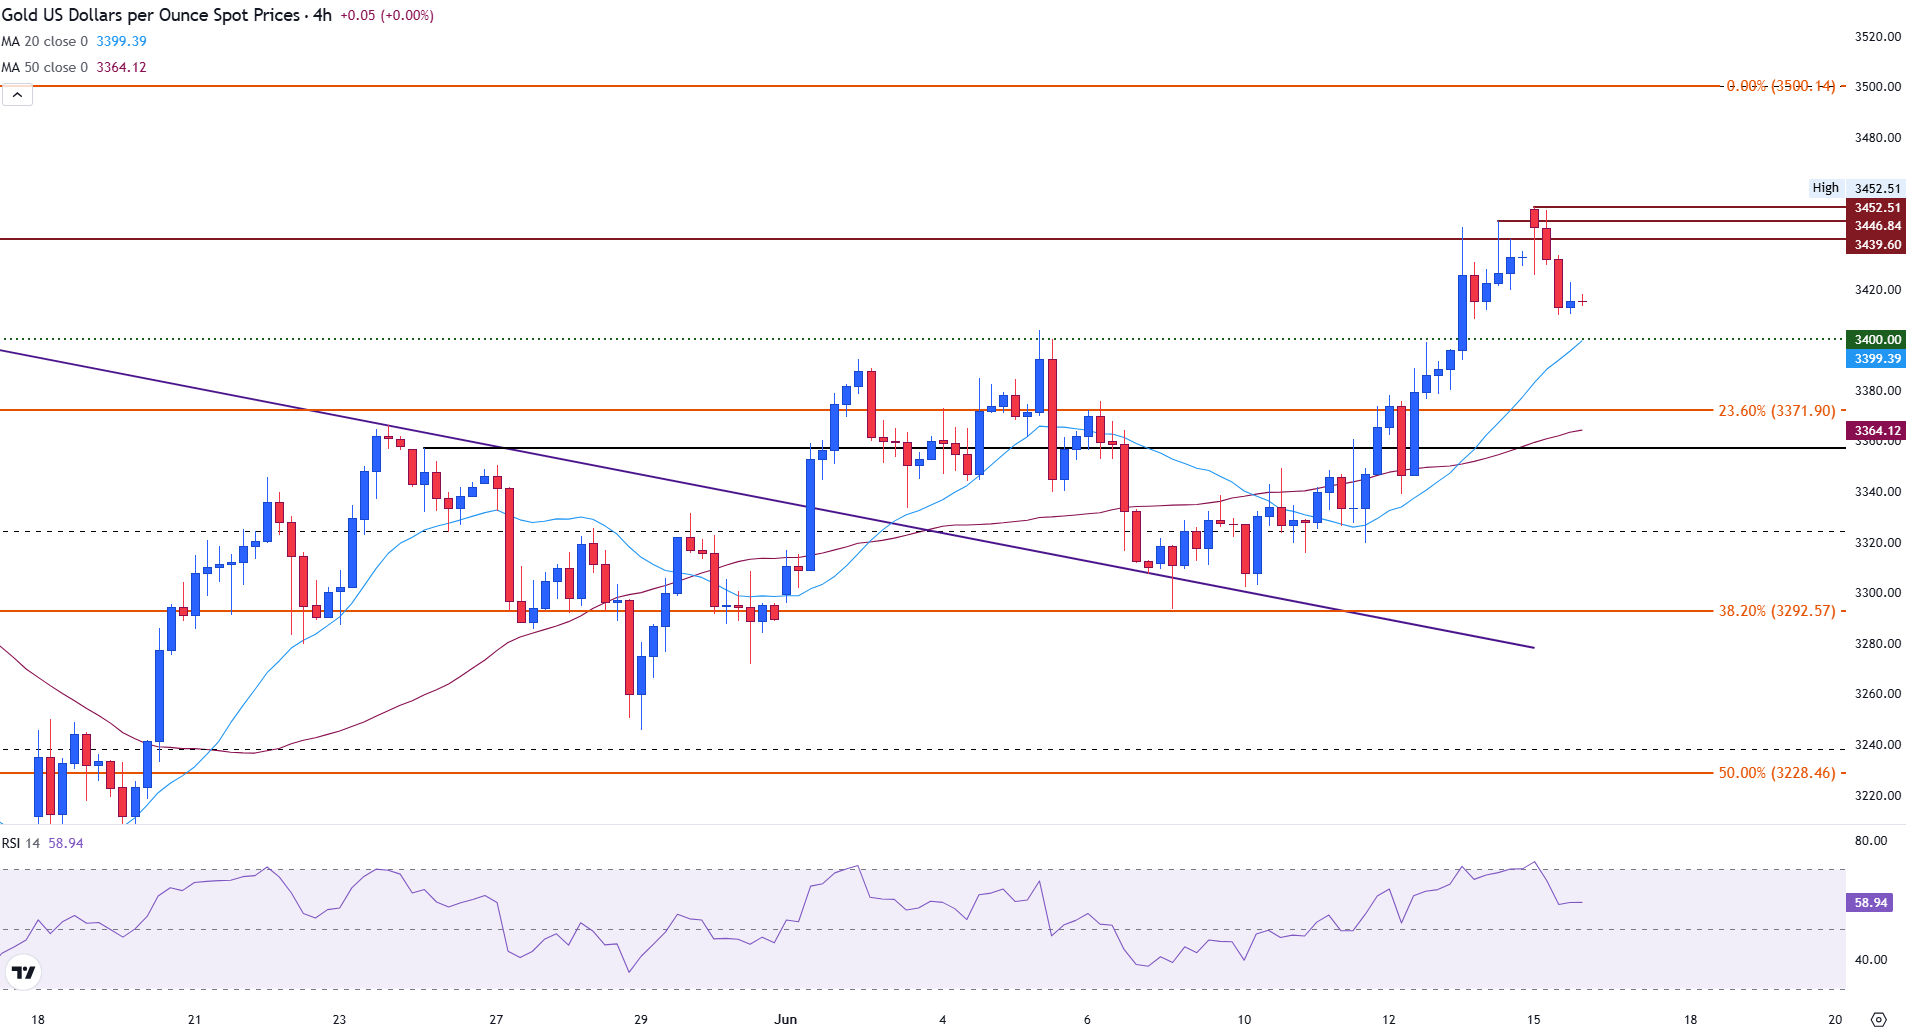
Beyond that level, the 50-period SMA at $3,363 provides another layer of defense, with deeper support levels at the 38.2% Fibonacci retracement level, located near $3,292.
Meanwhile, the Relative Strength Index (RSI) indicator on the 4-hour chart is at 59 and is stabilising after falling below overbought conditions, suggesting that the bullish bias remains intact, albeit with a slight easing of momentum.
More By This Author:
Oil Price Forecast: WTI Rallies To $74 Before Settling Above $72USD/CAD Breaks 1.3600 As U.S. Dollar Weakness Returns
Gold Prices Soar After Israel Attack On Iran Sparks Safe-Haven Flows


Comments
Log in or sign up to join the conversation.