

Image Source: Pixabay
Silver price retraces after hitting a weekly high of $21.67, after climbing sharply on Wednesday, following the release of the Federal Reserve’s (Fed) November meeting minutes, which weakened the US Dollar (USD). Also, factors like China’s Covid-19 crisis failed to trigger a flight to safety into the white metal. Hence, the XAG/USD trades at $21.47 a troy ounce.
On Thursday, Wall Street is closed in observance of the Thanksgiving holiday. The last meeting minutes of the Federal Reserve showed that “A substantial majority of participants judged that a slowing in the pace of increase would likely soon be appropriate,” giving the green light to investors seeking riskier assets. However, caution is warranted, as policymakers expressed “uncertainty” about how high rates need to go after emphasizing that inflation in the United States (US) remains “too high.”
Regarding Wednesday’s US economic calendar, S&P Global PMIs witnessed most indices moving into contractionary territory, another headwind for the US Dollar, while the Initial Jobless Claims for the last week jumped above forecasts, signaling that the labor market is easing.
On the positive side, US Durable Good Orders for October surprisingly rose, while the University of Michigan (UoM) Consumer Sentiment for November portrayed Americans are optimistic about the economy. The University of Michigan poll updated inflation expectations, with one-year ticking down to 5%, while for a 5-10 year horizon, were unchanged at 3%.
Back to price action, the US Dollar Index (DXY), a gauge of the buck’s value vs. its peers, drops by 0.21% at 105.875, extending its losses to three days. US Treasury yields, mainly the 10-year benchmark, followed suit, falling three bps at 3.663%.
Silver Price Forecast (XAG/USD): Technical outlook
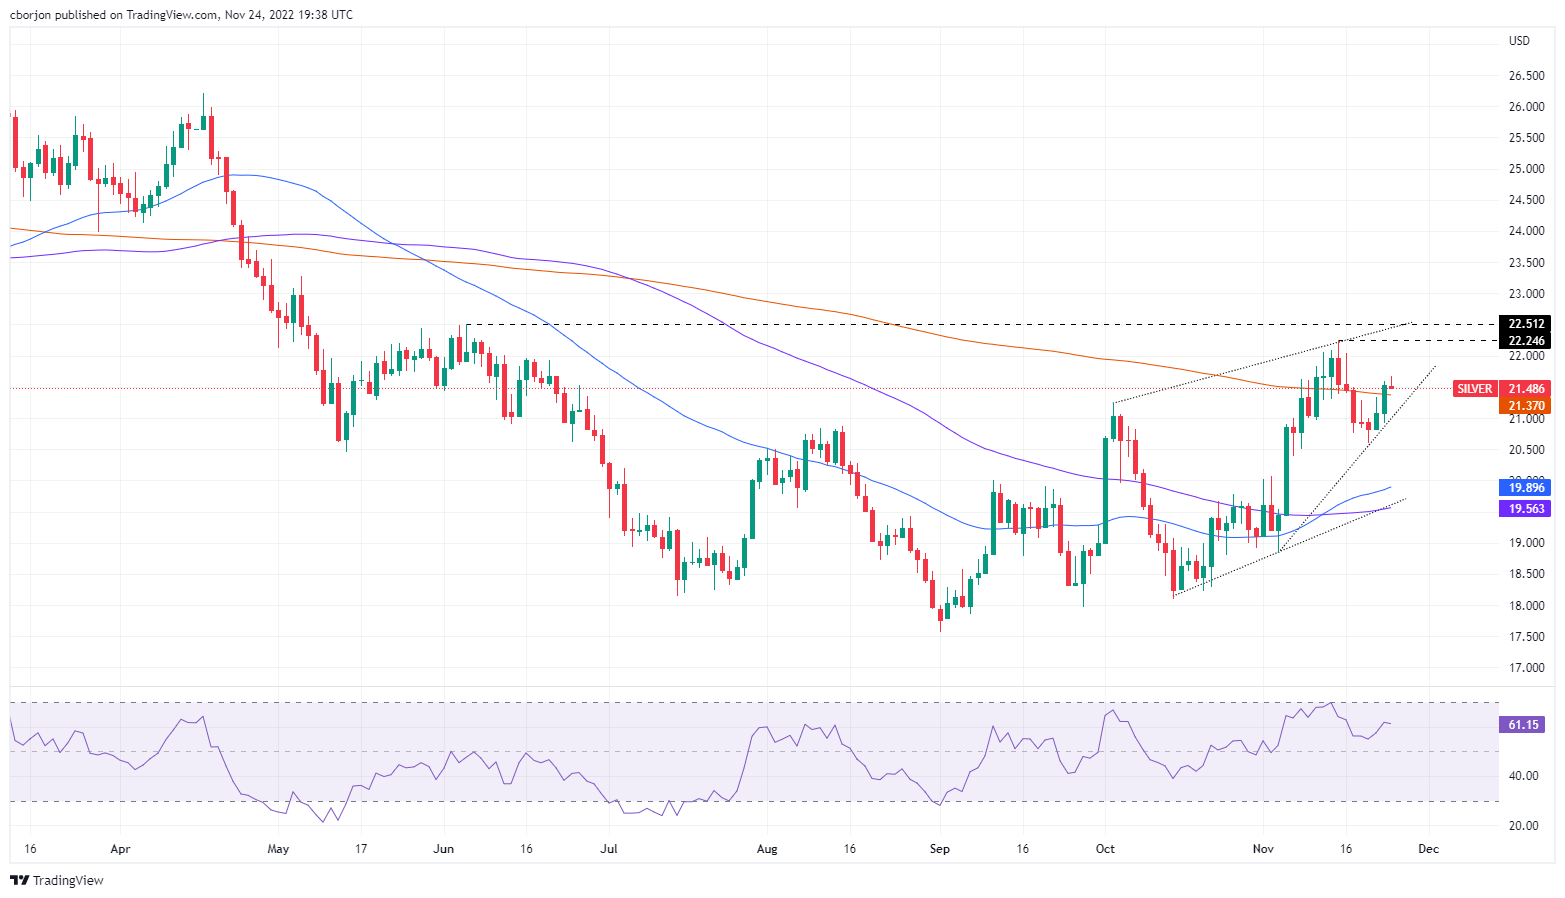
Albeit Silver price retreated from weekly highs, it remains above the trendsetter 200-day Exponential Moving Average (EMA) at $21.37, sought as support by the white metal buyers. The XAG/USD bias remains upwards, and it could resume its uptrend if buyers reclaim $22.00. if that scenario plays out, the XAG/USD following resistance would be November 15 high at $22.24, followed by the June 6 high at $22.51. Otherwise, the XAG/USD first support would be the 200-day EMA at $21.37, followed by the psychological $21.00 mark.
(Click on image to enlarge)
More By This Author:
Shiba Inu Price Gets Stuck In Tripwire Bears Laid Out As Thanksgiving Rally Stalls
AUD/JPY Price Analysis: Ascending Triangle Indicates A Volatility Contraction Ahead
EUR/USD Forecast: Fears likely to push the pair towards 1.0760


Comments
Log in or sign up to join the conversation.