

Image Source: Pexels
- Shiba Inu price sees its two-day winning streak being halted by a bearish counterforce.
- SHIB fades over 1% for the day as a technical rejection gets underway.
- At risk is a return to the lows of November if bulls lose their confidence.
Shiba Inu (SHIB) price appears to be choking on a piece of turkey or a wishbone this Thanksgiving as a two-day rally gain of 7% stalls. Although some profit-taking is quite normal, the moment and placing on the chart could not come at a worse moment as bears could be seen entering with large volumes. Depending on the US Dollar's further weakening and equities continuing their holiday rally, expect some counterweight and possible short-term decline back to the low of November.
SHIB chokes as bears enter the fray
Shiba Inu price tested the green ascending trend line from November 9 and saw a confirmed test on November 14. After price action broke below it, bulls are currently testing to break back above it, though they failed on Wednesday at the close. A second test happened this morning in the ASIA PAC session and failed again, as this time the red descending trend line came in to deliver a firm rejection. Could it be that the bulls have turned their attention to the Detroit Lions and turkey?
SHIB is currently at risk of turning into a bull trap, seeing how the rejection is being swamped with sell orders and bears are returning to run price action down. A similar pattern can be seen in the US Dollar which peaked overnight and now is dropping back lower. It looks to be going hand in hand with SHIB. In case the US dollar fades even more, and equities take a step back, expect to see a return to the low of this week near $0.00000817.
(Click on image to enlarge)
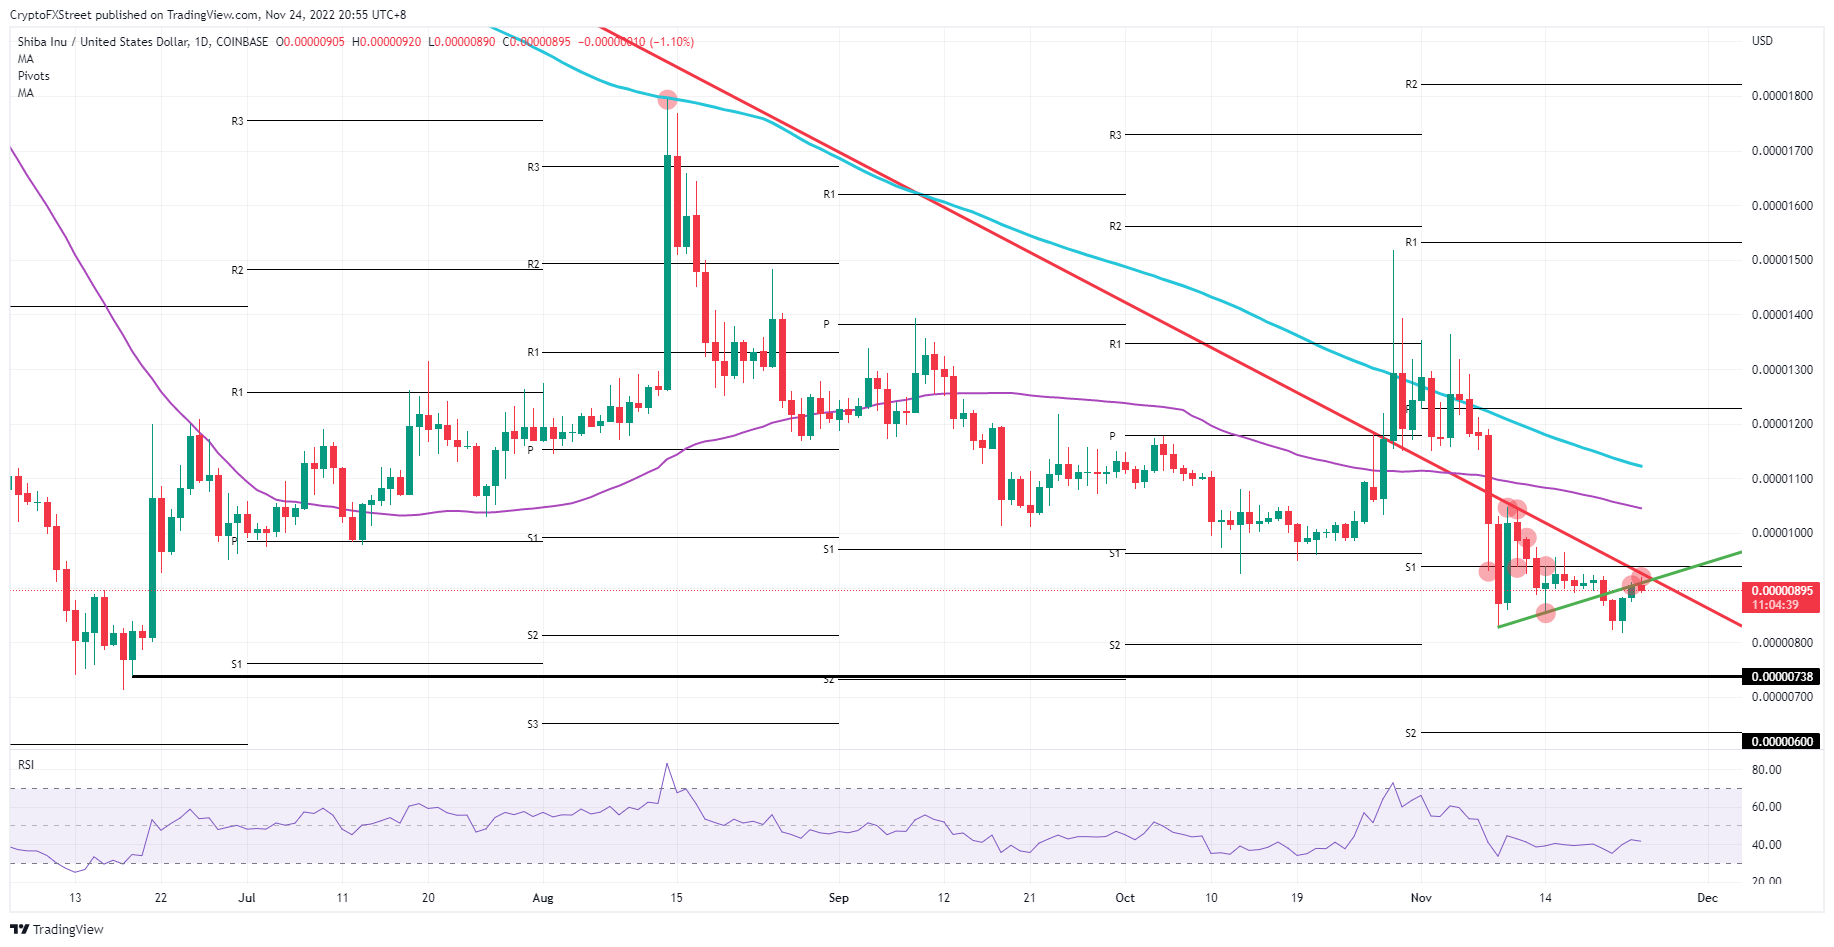
SHIB/USD daily chart
With the holiday season, this fade could simply be seen as a short pause, while the US is digesting their pumpkin pies and stuffed turkey before buying back into cryptocurrencies. Once the price breaks above that red descending trend line, expect a quick pop higher toward $0.00001049 at the 55-day Simple Moving Average before jumping toward that 200-day SMA at $0.00001124. Traders that venture to buy this short dip are up for roughly a 25% increase in their portfolio.
More By This Author:
AUD/JPY Price Analysis: Ascending Triangle Indicates A Volatility Contraction AheadEUR/USD Forecast: Fears likely to push the pair towards 1.0760
Ethereum Gas Fees Hit Lowest Point Since June, Despite PoS Hardfork Delay


Comments
Log in or sign up to join the conversation.