

Image Source: Pixabay
- Silver drops influenced by Fed's Core PCE Price Index anticipation.
- Last week's bearish engulfing pattern and RSI hint at more declines.
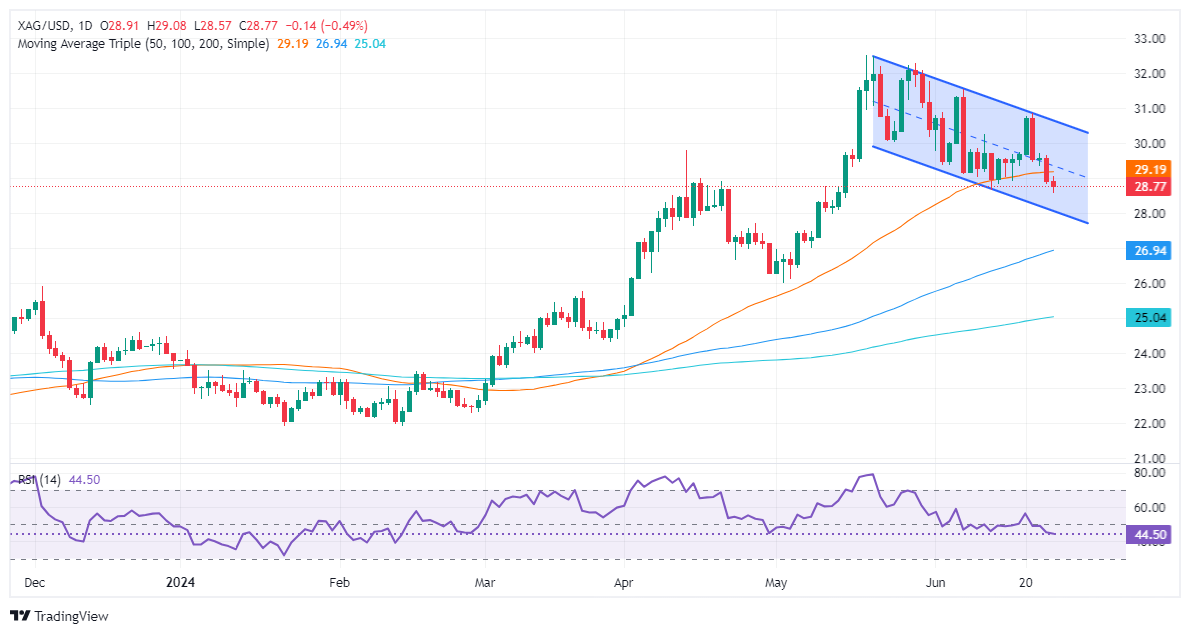
- Support levels: $28.28 (June 10 high), $28.00, $27.01 (May 8 low), $26.82 (100-DMA).
- Resistance points: $29.17 (50-DMA), $31.54 (June 7 high), $32.00, $32.51 (YTD high).
Silver price fell on Wednesday as market participants awaited the release of the Fed’s preferred inflation gauge, the core Personal Consumption Expenditure (PCE) Price Index, after releases from major countries hinted at a reacceleration of inflation. The XAG/USD spot price is at $28.76, down by 0.46%.
XAG/USD Price Analysis: Technical outlook
The grey metal formed a ‘bearish engulfing’ chart pattern last week, indicating potential for further downside. Momentum support sellers, as measured by the bearish Relative Strength Index (RSI), suggest that silver could extend its losses.
Therefore, XAG/USD's first support is the June 10, 2021, high at $28.28. A breach of the latter will expose the psychological $28.00 mark, followed by the May 8 swing low of $27.01, ahead of the 100-DMA at $26.82.
Conversely, if XAG/USD resumes its uptrend, the next resistance level would be the 50-day moving average (DMA) at $29.17. Surpassing this level would target the June 7 high of $31.54. Clearing this would aim for $32.00 before challenging the year-to-date (YTD) high of $32.51.
XAG/USD Price Action – Daily Chart
XAG/USD
| OVERVIEW | |
|---|---|
| Today last price | 28.77 |
| Today Daily Change | -0.14 |
| Today Daily Change % | -0.48 |
| Today daily open | 28.91 |
| TRENDS | |
|---|---|
| Daily SMA20 | 29.95 |
| Daily SMA50 | 29.18 |
| Daily SMA100 | 26.88 |
| Daily SMA200 | 25.01 |
| LEVELS | |
|---|---|
| Previous Daily High | 29.67 |
| Previous Daily Low | 28.84 |
| Previous Weekly High | 30.86 |
| Previous Weekly Low | 28.93 |
| Previous Monthly High | 32.51 |
| Previous Monthly Low | 26.02 |
| Daily Fibonacci 38.2% | 29.16 |
| Daily Fibonacci 61.8% | 29.35 |
| Daily Pivot Point S1 | 28.61 |
| Daily Pivot Point S2 | 28.32 |
| Daily Pivot Point S3 | 27.79 |
| Daily Pivot Point R1 | 29.44 |
| Daily Pivot Point R2 | 29.96 |
| Daily Pivot Point R3 | 30.26 |
More By This Author:
Silver Price Analysis: XAG/USD Collapses Below 50-DMA As Surrenders $29.00
AUD/JPY Price Analysis: Hits 17-Year High Above 106.00 On JPY Weakness
Gold Price Drops On Firm US Yields, Strong USD After Solid US Data
Comments
Log in or sign up to join the conversation.