

Image Source: Pixabay
- Silver comes under heavy selling pressure on Monday, though lacks follow-through.
- The technical setup still supports prospects for the emergence of some dip-buying.
- A convincing break below the $23.00 mark is needed to negate the positive outlook.
Silver kicks off the new week on a downbeat note and snaps a four-day winning streak to a nearly two-month high, around the $24.15 region touched on Friday. The white metal maintains its offered tone through the early part of the European session and trades around the $23.75 zone, down over 1.30% for the day.
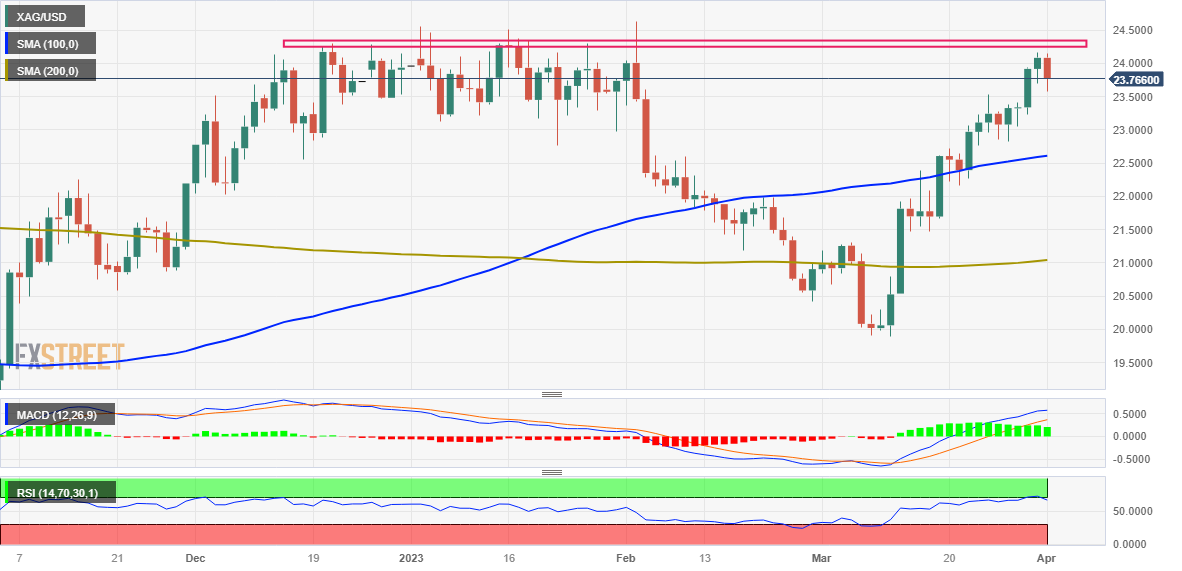
From a technical perspective, the recent strong move up from the YTD low - levels just below the $20.00 psychological mark, stalls ahead of the $24.20-$24.25 static resistance, which should now act as a pivotal point. Some follow-through buying, leading to a subsequent strength beyond the multi-month peak, around the $24.60-$24.65 area touched in February, will b seen as a fresh trigger for bullish traders.
Given that oscillators on the daily chart have pulled back from overbought territory, the XAG/USD might then aim to reclaim the $25.00 psychological mark for the first time since April 2022. The upward trajectory could get extended further towards the next relevant hurdle near the $25.75-$25.80 region en route to the $26.00 round-figure mark and the April 2022 swing high, around the $26.20-$26.25 area.
On the flip side, the daily low, just ahead of the mid-$23.00s, now seems to protect the immediate downside. Any subsequent slide is more likely to attract fresh buyers near the $23.00 mark and remain limited near the $22.80-$22.75 region. That said, a convincing break below might prompt some technical selling and drag the XAG/USD towards the $22.25 intermediate support en route to the $22.00 round-figure mark.
Silver daily chart
(Click on image to enlarge)
Key levels to watch
XAG/USD
| OVERVIEW | |
|---|---|
| Today last price | 23.76 |
| Today Daily Change | -0.32 |
| Today Daily Change % | -1.33 |
| Today daily open | 24.08 |
| TRENDS | |
|---|---|
| Daily SMA20 | 22.17 |
| Daily SMA50 | 22.21 |
| Daily SMA100 | 22.59 |
| Daily SMA200 | 21.03 |
| LEVELS | |
|---|---|
| Previous Daily High | 24.16 |
| Previous Daily Low | 23.7 |
| Previous Weekly High | 24.16 |
| Previous Weekly Low | 22.83 |
| Previous Monthly High | 24.16 |
| Previous Monthly Low | 19.9 |
| Daily Fibonacci 38.2% | 23.98 |
| Daily Fibonacci 61.8% | 23.87 |
| Daily Pivot Point S1 | 23.8 |
| Daily Pivot Point S2 | 23.51 |
| Daily Pivot Point S3 | 23.33 |
| Daily Pivot Point R1 | 24.27 |
| Daily Pivot Point R2 | 24.45 |
| Daily Pivot Point R3 | 24.73 |
More By This Author:
OPEC Producers Announce Voluntary Oil Output Cuts
AUD/USD Stumbled On Expectations For A Fed Pivot After Softer US Inflation Data
USD/JPY Needs More BoJ Action To Justify A Big Move Lower – SocGen


Comments
Log in or sign up to join the conversation.