
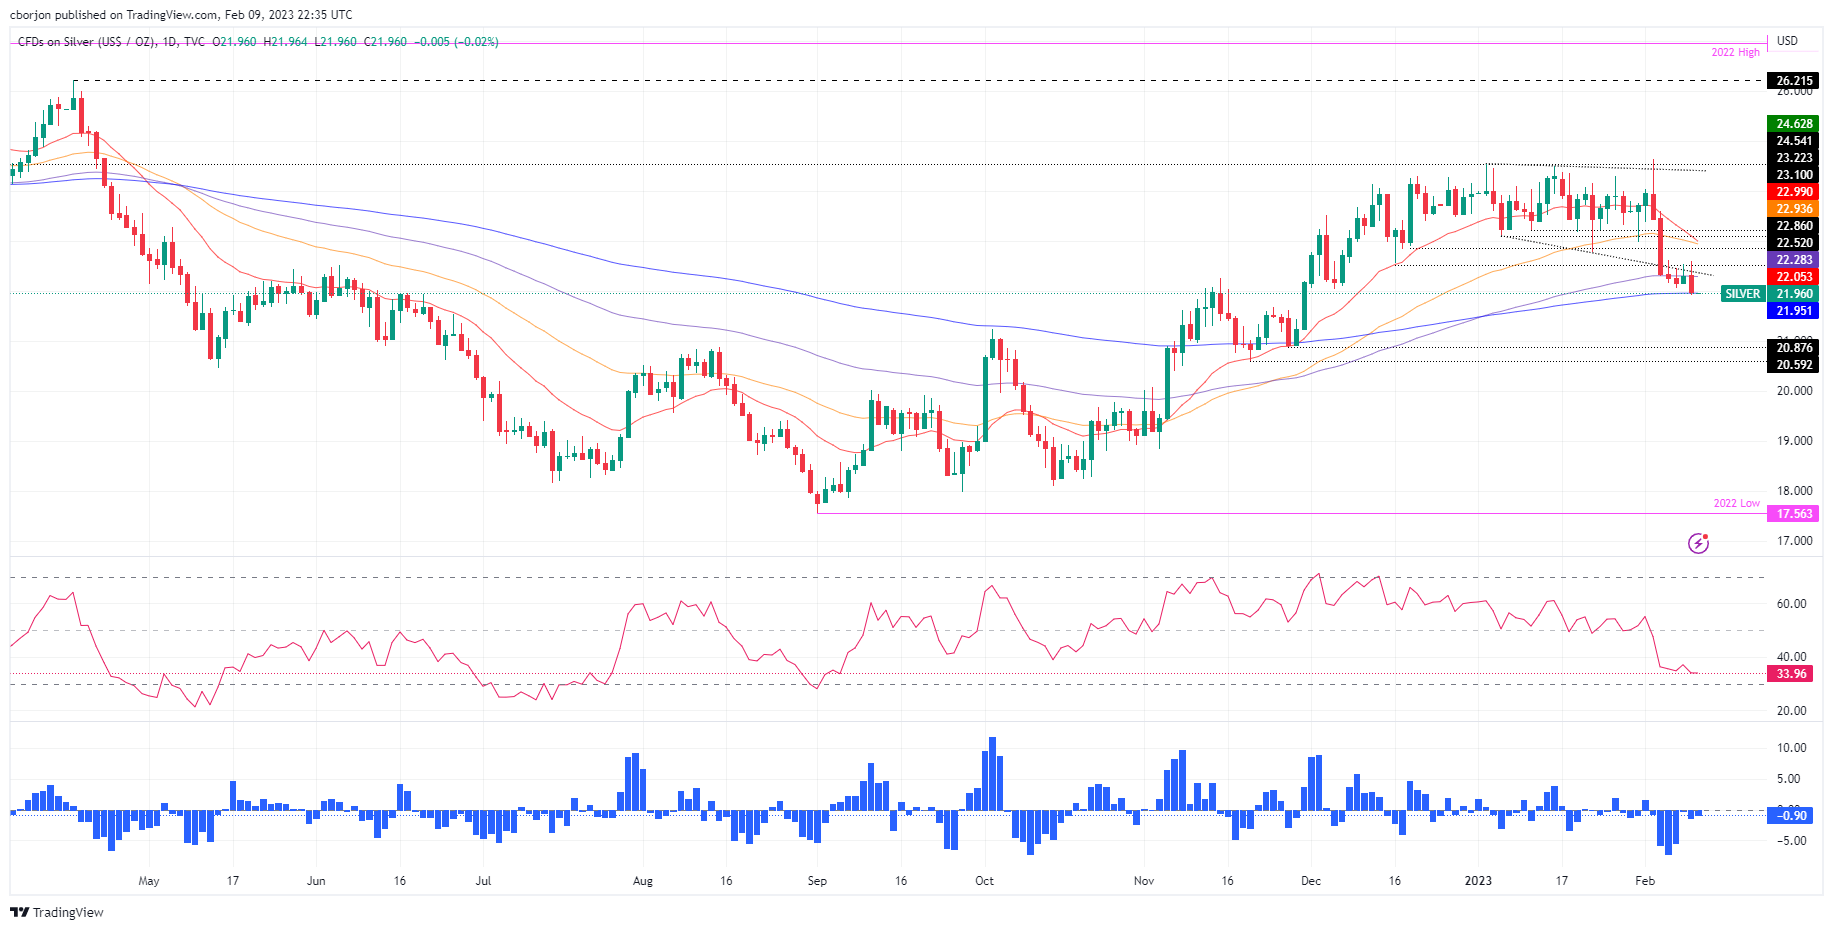
Silver price slides below a bottom-trend line of a bearish megaphone formation and is testing the 200-day Exponential Moving Average (EMA) at around $21.95. At the time of writing, the XAG/USD exchanges hands at $21.97.
From a daily chart perspective, XAG/USD threatens to crack the 200-day EMA, which, if accomplished, it could pave the way for further losses. In addition, oscillators turned bearish, notably the Relative Strength Index (RSI), while the Rate of Change (RoC) is almost flat, depicting that neither buyers/sellers are in control.
However, XAG/USD’s daily close below the 200-day EMA could send Silver prices diving. The next support area would be the $21.00 psychological price level, followed by the November 28 daily low of $20.87 and the November 21 low of $20.59.
As an alternate scenario, the XAG/USD’s first resistance would be the psychological $22.00 mark. A breach of the latter would expose a support-turned-resistance bottom trendline of the megaphone formation at $22.40, followed by the high of the week at $22.59.
Silver Daily Chart
(Click on image to enlarge)
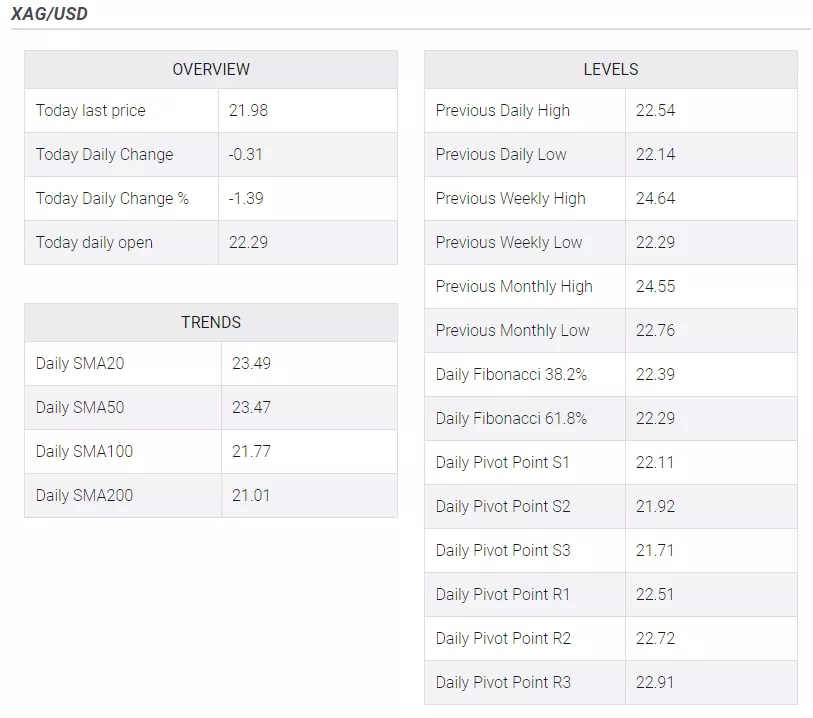
Silver key technical levels
More By This Author:
Gold Price Forecast: XAU/USD Stays Firm At Around $1875 Despite A Strong US Dollar As US Real Yields Fall
WTI Rallies Towards $76.50 As The USD Remains Offered Due To Powell’s Speech
USD/JPY Price Analysis: Bulls Move In And Target 133.00 Ahead Of The 200-DMA


Comments
Log in or sign up to join the conversation.