Silver Price Analysis: XAG/USD Breaks Two-Month Resistance Trendline, Pierced $23.90
Silver price broke a two-month resistance trendline, reaching a new 8-week high of $23.92 due to overall US Dollar (USD) weakness and falling US Treasury bond yields. Therefore, the XAG/USD is trading at $23.74, up more than 2%, after hitting a low of $23.24.
XAG/USD Price action
From a daily chart perspective, the XAG/USD is upward biased and might soon test the YTD high at $24.63 once it reclaimed the $23.50 figure. But firstly, Silver buyers need to reclaim the $24.00 figure, ahead of challenging YTD highs. The Relative Strength Index (RSI) at overbought conditions continues to aim higher, while the Rate of Change (RoC) portrays buyers in charge. If XAG/USD fails to break $24.00, that could pave the way for a pullback.
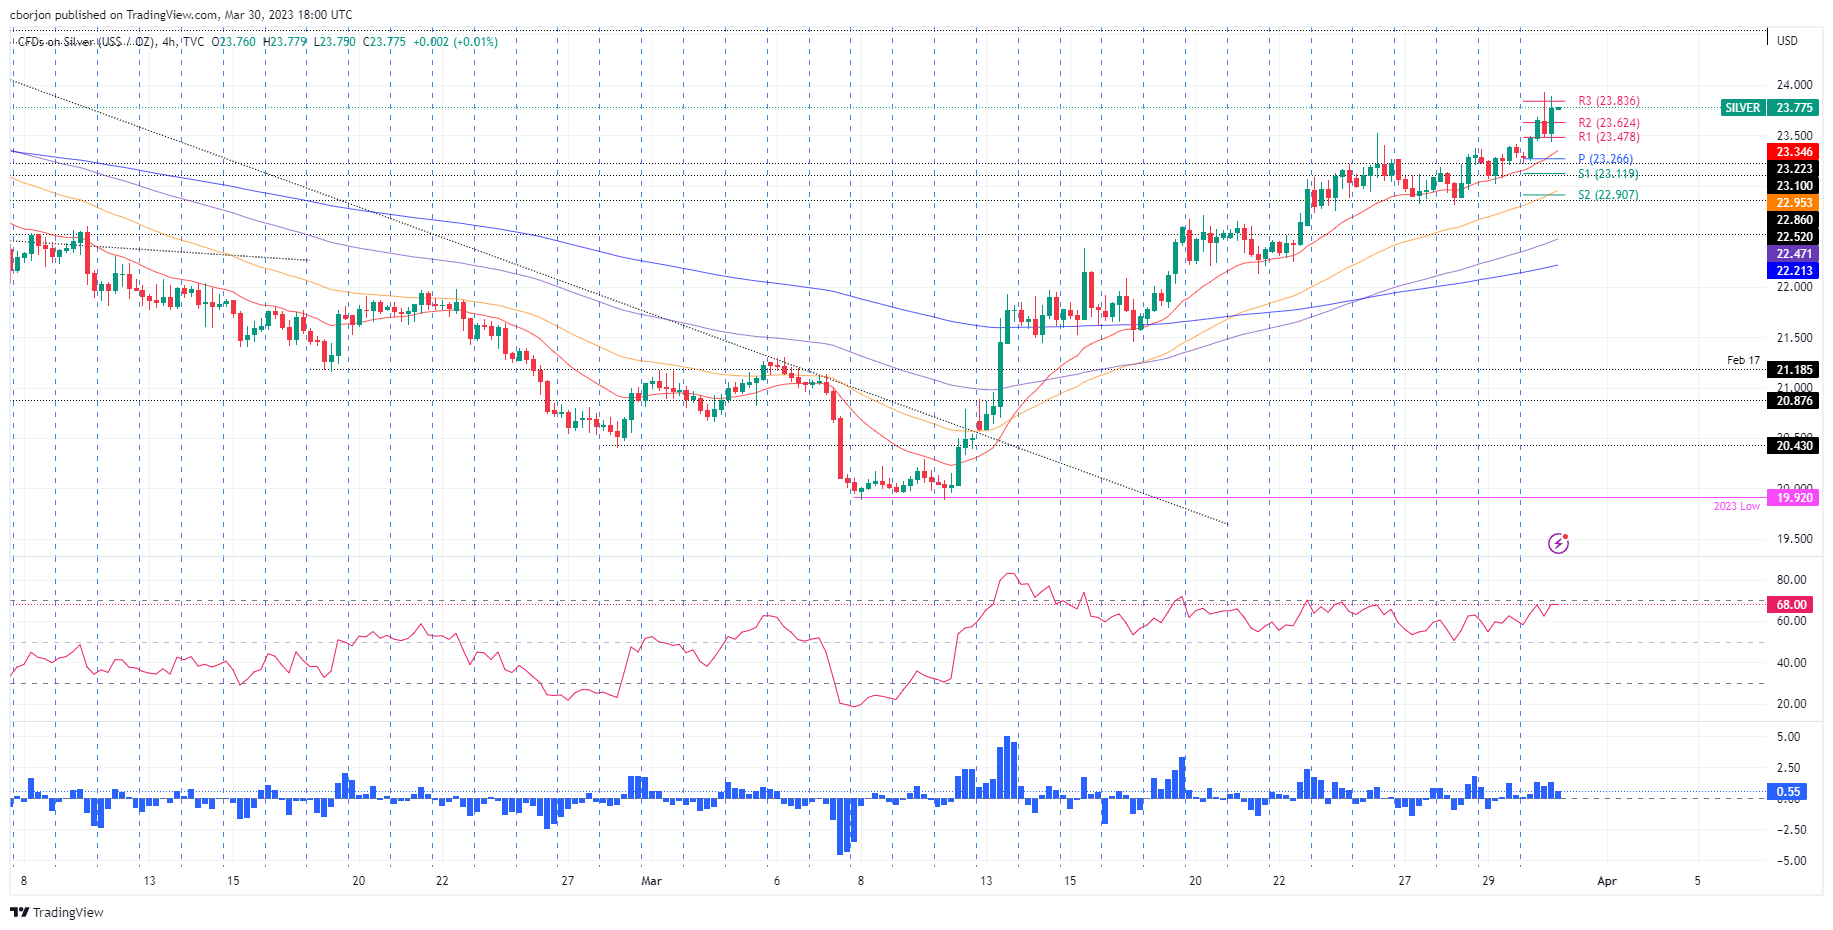
In the short term, the XAG/USD 4-hour chart portrays the white metal in a solid uptrend, testing the R3 daily pivot point at $23.83 after hitting a daily high of $23.92. If the XAG/USD conquers $24.00, that will expose the YTD high. The Relative Strength Index (RSI) justifies an upward continuation at bullish territory, while theRate of Change (RoC) does it too.
On the flip side, if the XAG/USD stumbles beneath the R2’s daily pivot at $23.62, it would pave the way for further downside. Hence, the XAG/USD first support would be the R1 pivot point at $23.47, followed by the intersection of the 20-EMA and the daily pivot point at $23.30, before diving towards the S1 pivot point at $23.11.
XAG/USD 4-hour chart
(Click on image to enlarge)

XAG/USD Technical levels

More By This Author:
NZD/USD Refreshes Daily Top, Trades Just Below Mid-0.6200s Amid Positive Risk Tone
WTI Failed To Rally Despite Inventory Decrease In The United States
USD/CAD Stages A Modest Recovery From Multi-Week Low, Upside Potential Seems Limited
Disclaimer: Information on these pages contains forward-looking statements that involve risks and uncertainties. Markets and instruments profiled on this page are for informational purposes only ...
more


