.webp)
Photo by Zlaťáky.cz on Unsplash
Last week's tops in precious metals, specifically gold, but to a lesser extent silver, have spurred online and televised debates about bubbles and overvaluation, and manias.
With animal spirits bubbling unrestrained in today’s day and age, we focus on basing our opinions in statistical analysis – numbers don’t lie, the commentator can twist the numbers into nonsense, but numbers themselves have no agenda, opinion, or political affiliation.
Attempting to explain away the metal price moves over the last several years, commentators have focused on a monetary reset, currency (especially the US dollar) debasement, debt (US-centric and global, but all US dollar-denominated), and their impacts on the destruction of the purchasing power of the US dollar.
In this edition of the Silver Nugget, we combine theory (i.e., a credit-based system driven by credit expansion (more on this in another issue) through leverage, resulting in an exponential decline of the purchasing power of the denominational currency, statistical analysis (some backward-looking information, regression, RSQs, and other pixie dust), and practical applications – using theory in an attempt to estimate low-risk entry points (accumulation) and exits (profit taking).
Theory – an increase in the US federal government debt level enables debt creation not only at the state and city level, but also bank credit expansion, driving consumer debt, commercial loans, auto loans, etc.
Theory suggests that each dollar of debt created by the US Treasury results in $30 of additional debt available in the credit system (using [Note: Lehman Brothers went down 17 years ago – is there anything else we can use here?] and Fannie Mae balance sheet leverage as reference).
Statistically, credit expansion (in absolute, not relative terms – i.e., numbers only, not purchasing power of those numbers – again, this is beyond the scope of this analysis) should therefore be forecastable.
Let’s run an experiment:
(Click on image to enlarge)
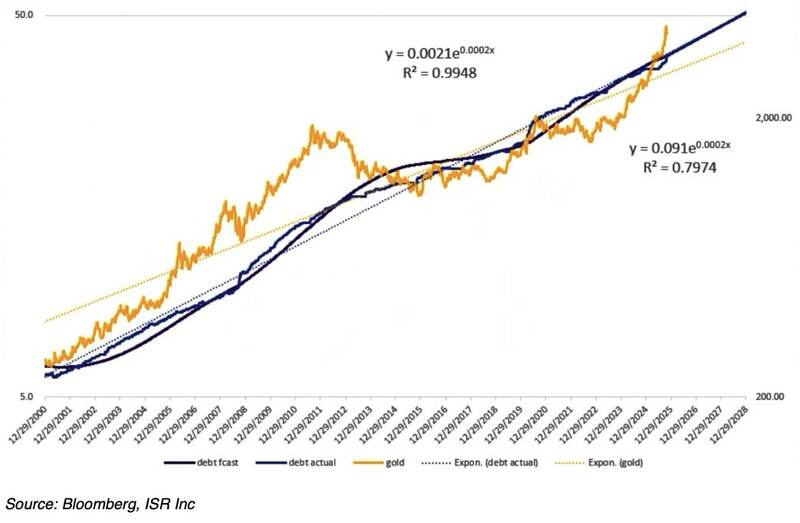
The above chart supports theoretical credit expansion being forecastable.
Over the last 25 years (indeed, we took the data back as far as available, not shown), the RSQ* of debt growth vs. time reaches a stunning 99.5, implying that the progression of time will result in and account for over 99% of monetary expansion.
Overlaid on the chart is the price of gold, showing a still statistically-significant relationship to time of 80. This suggests that 80 percent of the move in the price of gold can be explained by the expansion of credit and thus the devaluation of the US dollar over time.
The implication is that gold (and by extension silver – we’ll get to that soon) prices may be forecast if one has the ability to accurately forecast US dollar debt at the federal level. Again, with debt’s correlation to time being statistically significant, we believe we can create a theoretical model to be able to forecast debt levels and, therefore, gold prices.
We decided to backtest this approach by forecasting gold prices using the aforementioned relationship (to debt and time) using statistical outliers (sigma-based or absolute), we then attempt to identify low-risk entry and exit points through time.
Interestingly, the experiment provided positive outcomes more often than not, suggesting the theory holds.
The practical application is the ability to better time exposure to the precious metals sector, with a specific focus on silver.
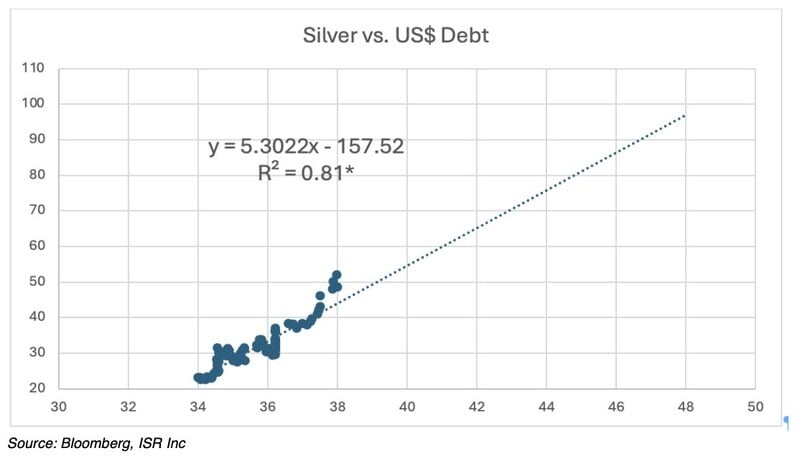
We ran the same analysis with silver vs gold (central banks have not been adding to silver holdings over the last two years, at least not to our knowledge, which has contributed to gold outperforming all commodities over that timeframe) and found a lower correlation to debt creation and time (there are, after all, more industrial applications for silver, and the supply/demand mechanics are also different).
However, this was still statistically significant and appears to provide useful low-risk signals for adding or reducing exposure to silver positions.
The signals employ statistically based metal price forecasting vs. actual metal prices with standard deviations (between the two) as triggers. Essentially, a metal price forecast is established based on debt growth and time, and historic standard deviations are used to create a low-risk entry point.
For example, if the metal price forecast exceeds the actual price by more than 1.0x standard deviations (we can vary this, of course), we would suggest taking profits. Interestingly, but perhaps not surprisingly, this occurred last week when silver hit $51.92/oz (on the weekly spot close), more than 16% higher than the statistically implied price of $44.72/oz. On a standard deviation basis, the signal started flashing caution the last week of September when silver hit $46.08/oz.
How successful was this approach, and what were the results of the last six ‘blow-off tops’ identified in our last missive (email sent October 23, 2025), specifically:
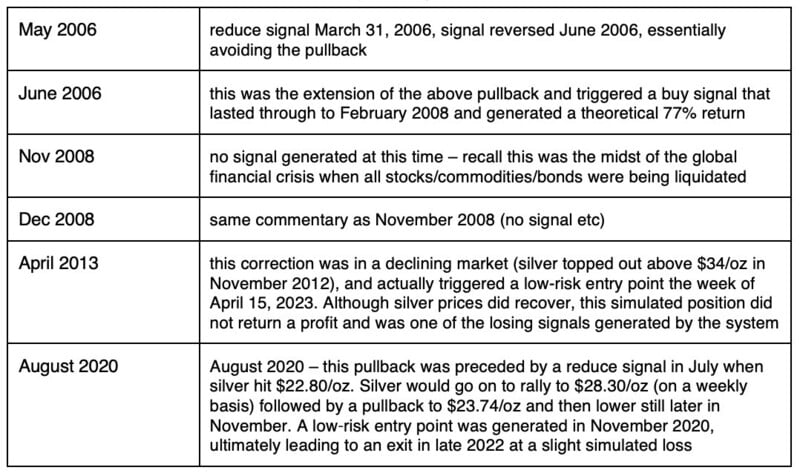
Presently, our statistical analysis indicates the low-risk entry point would be right around $46.00/oz were it to occur this week.
One keynote – we would not advise shorting silver or gold in any market. Granted, this would have been detrimental in the 1980-1990 period; however, the natural underlying trend – higher debt/more credit expansion (in absolute terms) – makes shorting anything that benefits from the naturally occurring devaluation of the denominator extremely risky (akin to shorting a stock with a significant dividend yield).
Here is a 30-year chart showing the statistically implied metal price, the actual price, and the entry/reduce points:
(Click on image to enlarge)
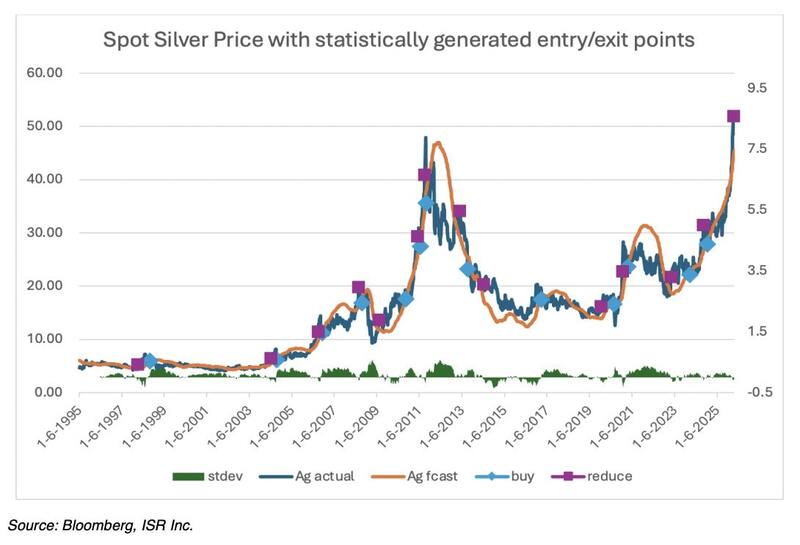
The results of the above experiment:
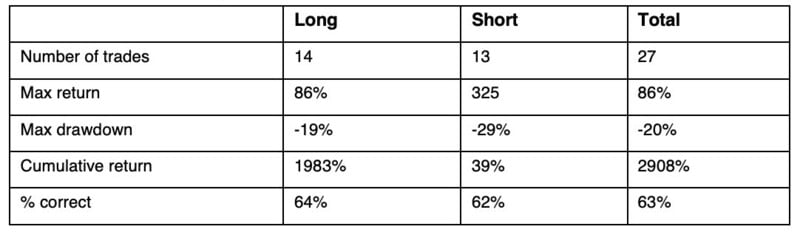
Although no system is foolproof, we believe the signals generated assist in keeping investors out of trouble in terms of adding to over-extended, high-risk positions and taking profits near statistical anomalies, like the one we recently witnessed.
Aside from the statistically induced signal generation, we can also use the statistically implied silver price relationship with debt and time to forecast silver prices into the future, being able to use both – time and scale. We note that this is an opinion based on statistical relationships that are based on historic numbers and cannot in any way guarantee the implied outcome.
Based on recent (last two years) data and utilizing historical time/debt relationships, the model suggests that US debt will reach $45 trillion by mid-2027. Based on historic time/debt/silver trends, a silver price of US$80/oz is implied.
In terms of potential statistical downside – an implied model discount of 40% (witnessed in 2011 following the last all-time high selloff) and 45% (during the depth of the global financial crisis), a silver price of $25-28/oz is possible. Trading at $48.63/oz as of Friday’s close, an argument for an ‘asymptotic’ trade may be made (make $31 vs. lose $24).
Conclusion
In conclusion, the theory – declining purchasing price of the dollar and its reflection in the price of gold and silver is primarily the result of credit expansion – appears to be statistically supported.
Further, this relationship may be useful to model implied vs. actual metal prices and thus statistically significant low- and high-risk entry points (i.e., increase exposure/decrease exposure signals).
Further, the relationship may be useful to model silver prices at a future point in time.
More By This Author:
Why Exactly Is The Federal Reserve Cutting Rates?
Indian Gold Demand Robust In September Despite High Prices
In The Blink Of An Eye The National Debt Exceeds $38 Trillion


Comments
Log in or sign up to join the conversation.