
Silver Extends Gains As Gold/Silver Ratio Is Eyeing 2021 Lows

Image Source: Pixabay
Silver broke higher last week sharply and decisively, while gold has not followed to the upside as strongly. However, with the gold–silver ratio falling, silver remains the stronger performer at this stage. Because of this relative strength, the move could be wave (3) of an ongoing five-wave bullish impulse, especially given the strong extension higher and the fact that gold is also approaching an all-time high.
(Click on image to enlarge)
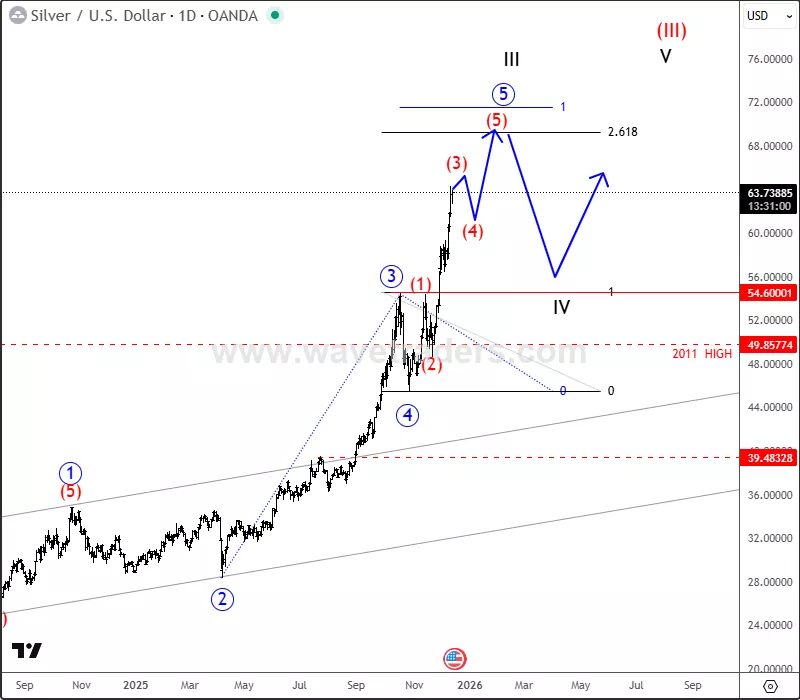
XAGUSD(silver) Daily Chart
Silver may continue to grind higher, and there appears to be room toward the 261.8% Fibonacci extension and the 68–70 zone to complete a lower-degree impulse within wave (3). Currently it can be trading in subwave 3 with room for more gains, just be aware of subwave 4 pullback before a bullish resumption within subwave 5 of (3).
(Click on image to enlarge)
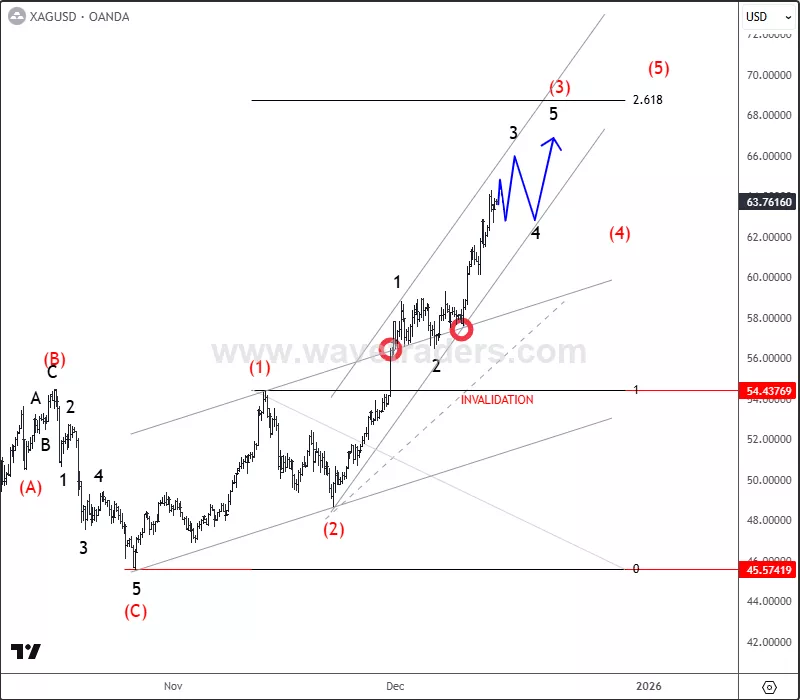
XAGUSD(silver) 4H Chart
The gold/silver ratio chart is trading impulsively lower, which is why precious metals remain under bullish pressure, with room for further gains until the ratio approaches its 2021 lows within a projected five-wave bearish impulse. Silver is outperforming gold, and it may continue to do so at least until early 2026, suggesting that silver could experience significantly more upside through the end of this year.
(Click on image to enlarge)
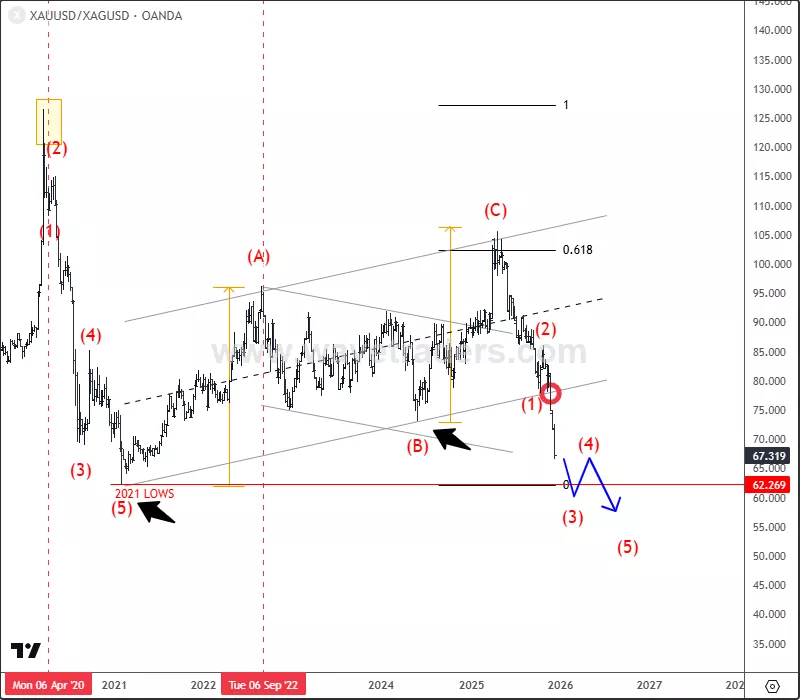
XAU/XAG(gold/silver) Ratio Chart
More By This Author:
SMH Is In Wave 5 Extension As Semiconductors Aim For 400 Area
GBP/USD Extends Rally As Bullish Impulse Builds
Aussie Resumes Its Recovery


