
Predicting The Lumber PPI For July-September
Calculated Risk (h/t pgl) noted the decline in futures lumber prices. Joseph has argued that this won’t necessarily show up in actual prices paid by the consumer for a while. I don’t have retail prices, but I have the BLS measure one step removed from consumers, the PPI for lumber.
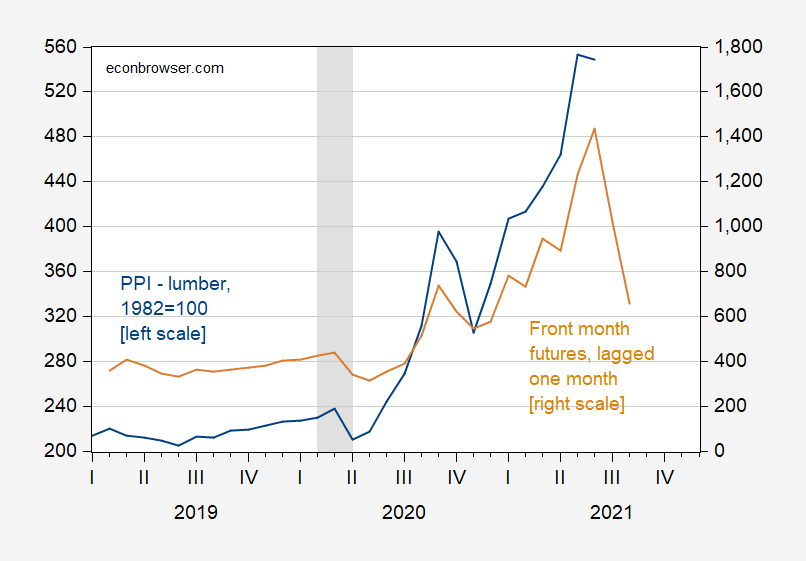
Figure 1: PPI for lumber and softwood (blue, left scale), and front-month futures, lagged one month (brown, right scale). NBER recession dates shaded gray. Source: BLS via FRED, macrotrends.com, NBER, and author’s calculations.
The correlation between the two variables seems pretty obvious, but just to illustrate the tightness of the fit, here is a scatterplot.
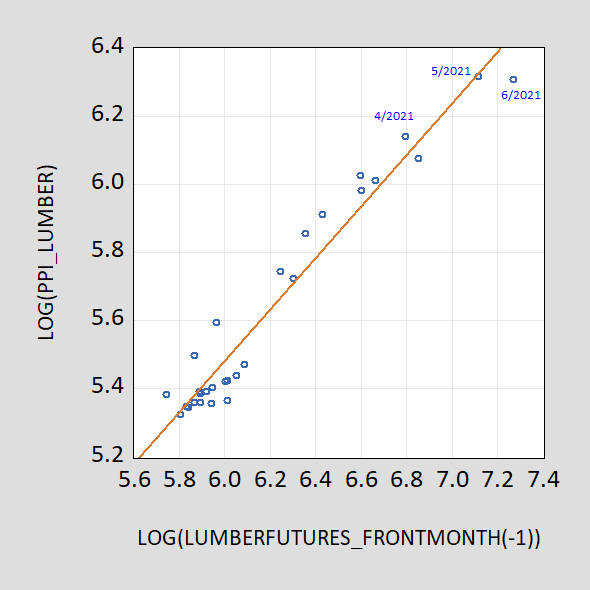
Figure 2: PPI for softwood lumber against front-month futures for softwood lumber lagged one month, both in logs. Futures data is a monthly average of daily data.
In my June post, I noted that a one percent futures basis (approximately log futures minus log current spot) does not necessarily imply a one percent decline in lumber prices, as would be implied in risk-neutral efficient markets setting. Mehrotra and Carter (2017) find that over the 1995-2013 period, at two months horizon, a one percentage point basis implies a 0.55 percentage point decline. This implied a 7% decline in the June PPI. As it turned out, the actual change was 7.3%.
Here I take another approach. Given the evidence of nonstationarity of both the PPI and futures in this sample period, I use the following equation in log first differences to forecast:
Δppi_lumbert = 0.01 + Δ0.67lumber_futuret-1
Adj-R2 = 0.64, SER = 0.054, DW = 2.27, Nobs = 28. bold denotes significance at the 1% level using HAC robust standard errors.
This regression yields the following forecast:
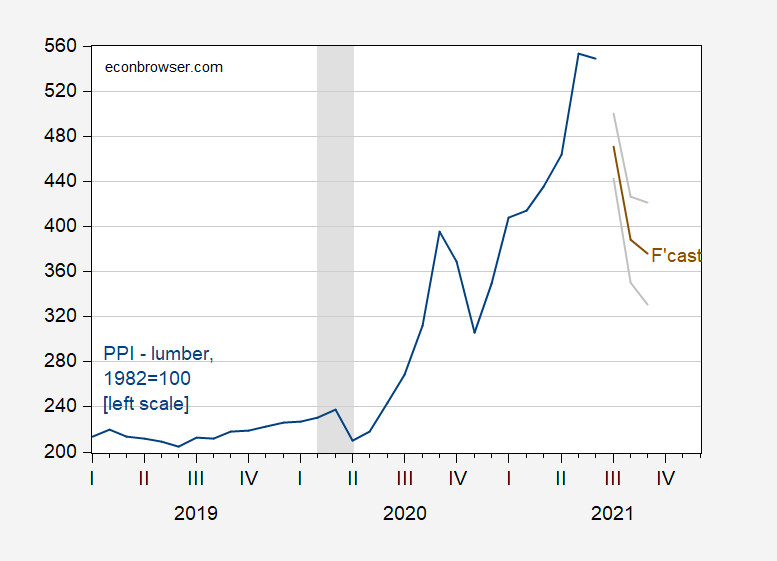
Figure 3: PPI for lumber and softwood (blue, left scale), and forecast (see text) (dark brown,), and +/- 1 standard error (gray). NBER recession dates shaded gray. Source: BLS via FRED, NBER, and author’s calculations.
The model forecasts 15.3%, 19.3%, and 3.2% in July, August, and September, respectively (all calculated as log differences). The forecast brings the September PPI to the average of December 2020/January 2021 levels.
Disclosure: None.


