Opportunities In The Silver & Uranium Markets
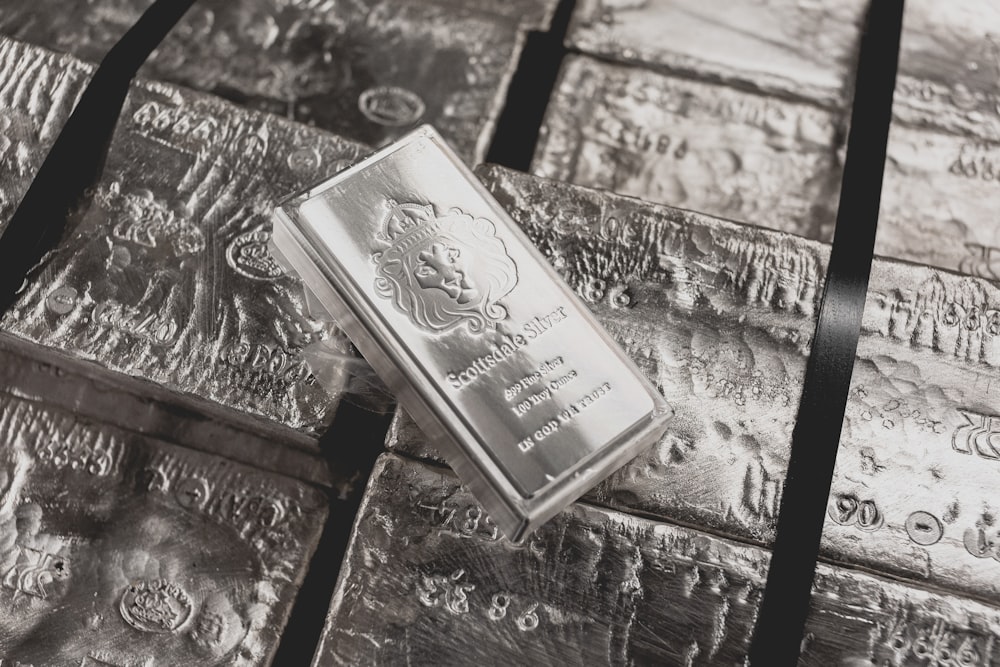
Photo by Scottsdale Mint on Unsplash
This article ventures into two captivating markets: silver and uranium. While distinct in nature, both markets offer opportunity and promise for investors seeking to diversify their portfolios. Silver, as explained in when silver will run to $50, has explosive upside potential, as per the CoT setup. Uranium, as per our uranium outlook 2023 & 2024, is very close to meeting our breakout criteria.
Silver Market Opportunities
In the aforementioned silver analysis, we employ a magnifying glass on two crucial elements that sculpt the silver market's prospects. First, we underscore the significance of the 9-month rounded pattern, a telltale sign in technical analysis that a shift in sentiment might be brewing. This pattern serves as a compass, indicating the transition from bearish to bullish or vice versa. As the pattern's contours develop, investors can glean insights into the market's trajectory, guiding their strategic decisions.
Second, we delve into the silver Commitment of Traders (CoT) report, an invaluable tool that reveals the sentiment of different trader categories. The report acts as a window into the collective market psychology and offers a snapshot of where the smart money is flowing. The bullish portrait painted by the net positions of commercials and non-commercials alludes to the potential for higher silver prices. By combining the insights from both the 9-month rounded pattern and the CoT report, investors can piece together a more comprehensive understanding of the market's movement, providing a solid basis for their investment choices.
The article concludes that silver’s 10-year rounded pattern, once it gives up (to the upside), will be the ultimate confirmation that the first phase of a big run is starting, leading silver to our first bullish target of 34.90 USD, as explained in great detail in our silver forecast 2023.
Uranium Market Opportunities
Our examination of the uranium market is centered around uranium’s leading indicators. These indicators, showcased through multiple timeframes, unveil the essence of uranium's potential trajectory. The journey begins with top-down scrutiny of the uranium spot chart, where the longest-term perspective unfurls a bullish reversal. Key levels and patterns define this analysis, creating a roadmap for discerning market movements.
Moreover, we feature the criteria that dictate the market's transition into a bullish stance. With precision, we emphasize the imperative roles of the URA ETF clearing the 22.2-23.3 area on a 5-day closing basis and the spot uranium ascending above the 62-65 range. These precise thresholds mark pivotal turning points, heralding an acceleration in the market's upward momentum. By coupling these criteria with the exploration of leading indicators, investors are equipped with a multifaceted compass that guides their decisions as the uranium market evolves.
Conclusion
The allure of the silver and uranium markets lies not just in their price movements, but in the meticulous analysis that unveils their potential. For silver, the CoT report and chart patterns hold keys to understanding the underlying dynamics. In uranium's realm, the shift from 'bullish bias' to 'bullish' is grounded in concrete criteria that investors can monitor. As the two markets continue their intricate dances, informed investors stand poised to seize the opportunities that arise from their evolutions.
More By This Author:
When Exactly Will The Price Of Silver Start A Rally To $50?
XRP: The Most Fascinating Crypto Chart, In Disguise
Gold's Pursuit Of Record Highs


