Oil And Gas Take Center Stage
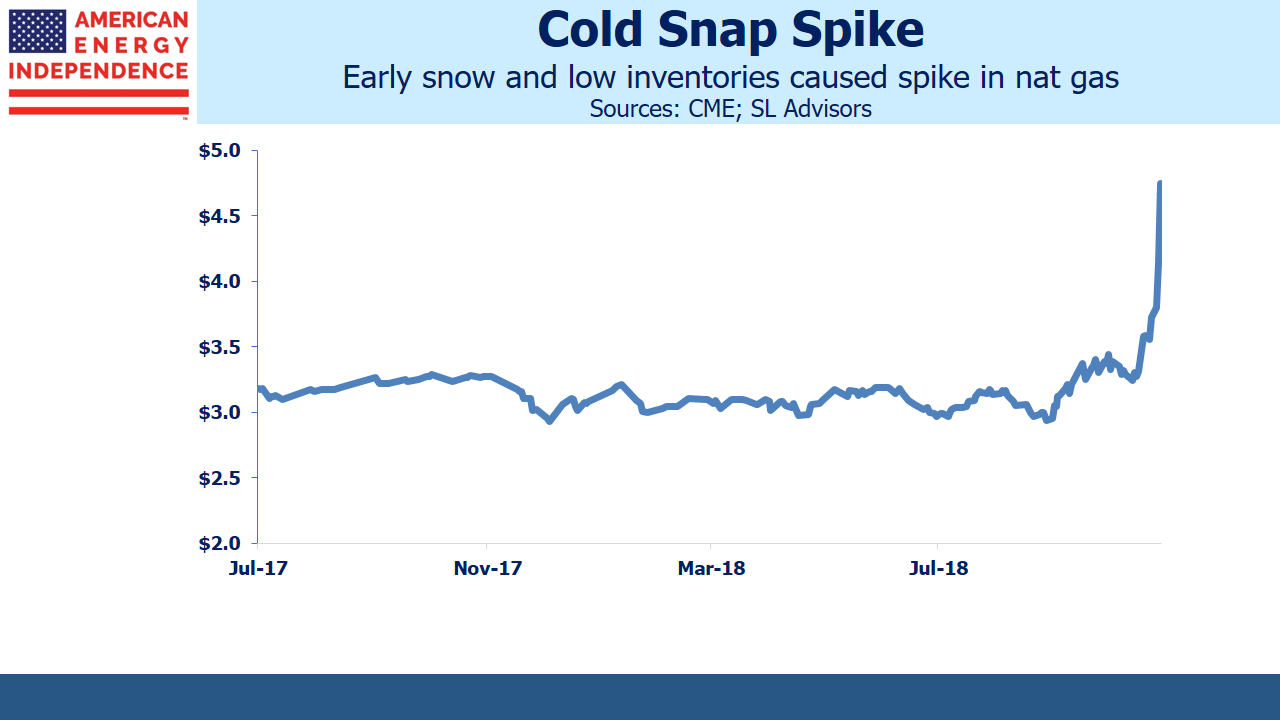
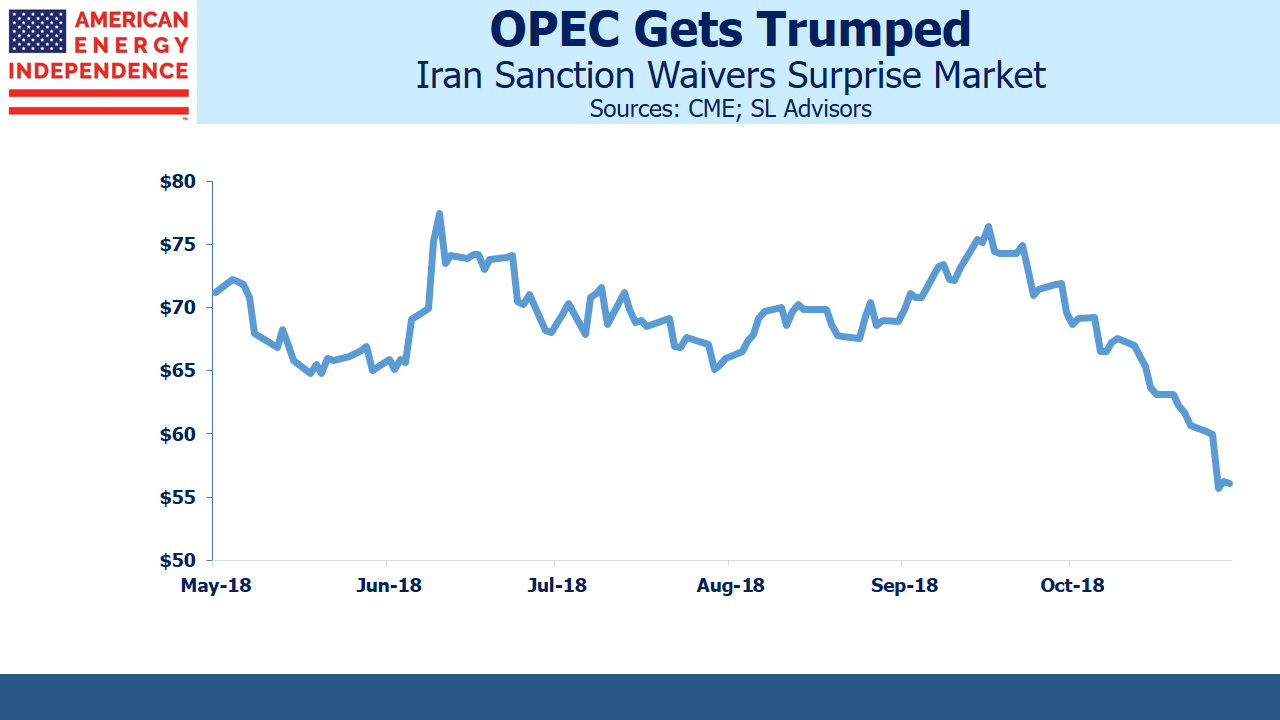
If pipeline stocks moved with natural gas rather than crude oil, their long-suffering investors could look back on a good week. On Tuesday crude was down $5 per barrel for the week, before recovering $2 by Friday. It’s tumbled $20 since early October, bringing Brent Jan ’19 to $66. By contrast, the Jan ’19 natural gas contract stormed out of its $2.90 to $3.50 per Thousand Cubic Feet (MCF) range that has constrained it all year, almost reaching $5 on Wednesday. Rarely have oil and gas been so disconnected.
The energy sector moves to the rhythm of crude. It’s is a global commodity, relatively easy to transport, which allows regional price discrepancies to be arbitraged away. Oil can move by ship, pipeline, rail or truck. Transportation costs vary from a few dollars per barrel for pipeline tariffs or waterborne vessel to $20 or more by truck. Although Canada’s dysfunctional approach to oil pipelines has led to deeply depressed prices, in most cases transport costs are a portion of the cost of a barrel.
By contrast, natural gas (specifically methane, which is used by power plants and for residential heating and cooking) generally only moves through pipelines or on specially designed LNG tankers in near-liquid form. Long-distance truck transportation isn’t common because liquefying methane to 1/600th of its gaseous volume requires thick-walled steel tanks. Methane moved as Compressed Natural Gas (CNG) is only 1% of its normal volume (i.e. requires 6X more storage volume than LNG) which generally renders long-haul truck transport uneconomic. LNG shipping rates from the U.S. to Asia are $5 or more per MCF, more than the commodity itself. The 10-15,000 mile sea journey is worth it because prices in Asia are $8-15 per MCF, compared with normally around $3 per MCF in the U.S.
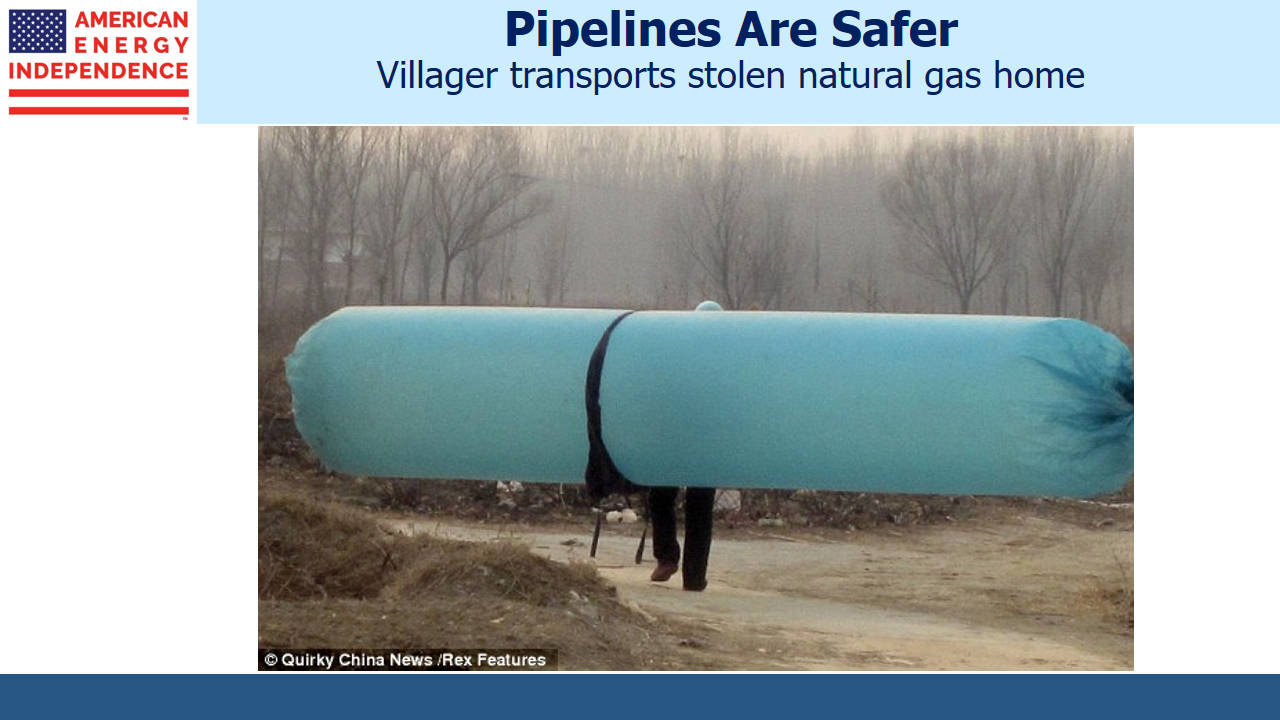
The result is that natural gas prices vary by region far more than crude oil.
There are price discrepancies within the U.S. too. The benchmark for U.S. natural gas futures is at the Henry Hub, located in Erath, LA. This is where buyers of $5 per MCF January natural gas can expect to take delivery. By contrast, 700 miles west in the West Texas Permian basin, natural gas is flared because there isn’t the infrastructure to capture it. Gas is flared because it’s worthless. Mexican demand is coming, but construction south of the border is running more slowly than expected.
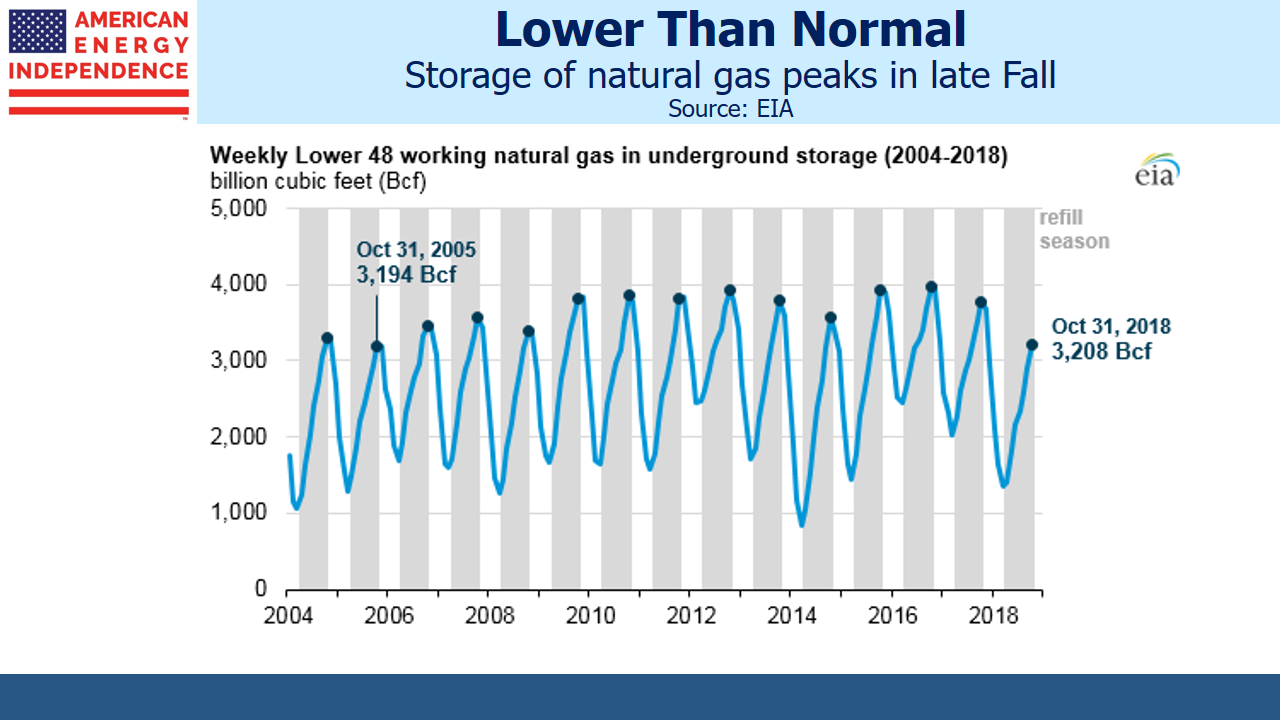
The price dislocation in U.S. natural gas highlights the ongoing need for additional pipeline and storage infrastructure. Price differences in excess of the cost of pipeline transport translate into pipeline demand. Although the spike in Jan ’19 natural gas futures reflects a temporary supply shortage that can’t be alleviated by a new pipeline given multi-year construction times, such events are generally good formidstream energy infrastructure businesses.
The oil price dislocation was at least partly due to hedging of option exposure by Wall Street banks that had sold put options to producers, such as Mexico. It has very little to do with midstream infrastructure. Having fretted for months over U.S.-imposed sanctions on Iran, the market was surprised by waivers that are softening the blow for Iran’s oil customers. It’s likely to create a reaction (see Crude’s Drop Makes Higher Prices Likely).
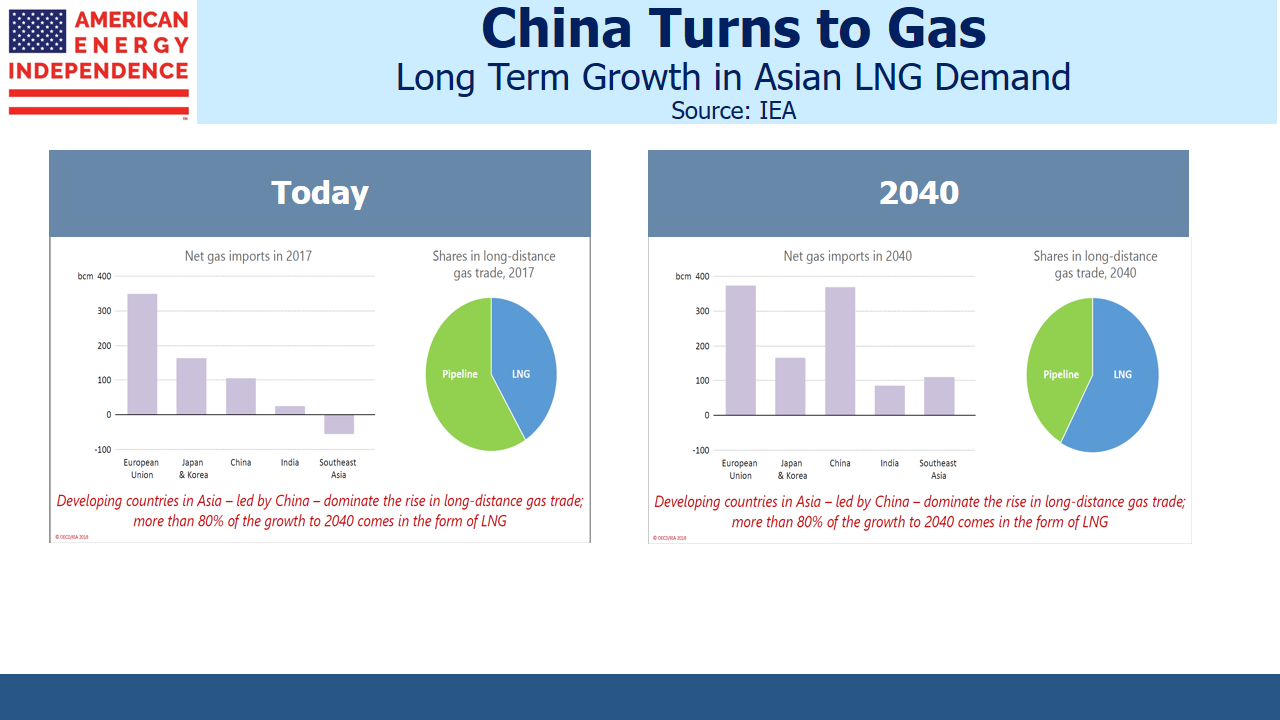
Long term forecasts of natural gas demand are less varied than for crude oil, and are driven by Asian consumption at the expense of coal for electricity production.Crude oil demand forecasts vary more, generally because of differing expectations for electric vehicle sales. Although both are growing, a bet on natural gas looks the safer of the two.
Nonetheless, crude oil moves the energy sector and U.S. pipeline stocks tag along. On Tuesday when crude oil was -6.6%, the S&P Energy ETF (XLE) and Williams Companies (WMB) both slid 2.3%. Jan ’19 natural gas was +9.1%. WMB derives virtually all its value from transporting and processing natural gas and natural gas liquids. Its inclusion in XLE probably causes it to move with the sector more than its business would suggest.
3Q18 earnings for pipeline companies have been largely equal to or better than expectations. The fundamentals remain strong – investors continue to ask when sector performance will reflect this. Although the recently declared dividend on the Alerian MLP ETF (AMLP) is 34% below its 2014 level, we expect corporations will start increasing dividends, with the American Energy Independence Index likely to experience 10% growth in 2019.
Disclosure: We are long WMB and short AMLP.
SL Advisors is the sub-advisor to the Catalyst MLP & Infrastructure Fund.To learn more about the Fund,please click more


Good article. I would welcome views on which companies to invest in as my choices including WMB have not done well. OKE is one of the few good ones that I have