
New All-Time High: Can Gold Break The $3,100 Barrier?

Image Source: Pixabay
Gold continues its impressive rally, reaching new all-time highs. Investors are turning to the precious metal as a safe-haven asset amid economic uncertainty. The latest surge in Gold prices (XAU/USD) highlights increasing concerns about inflation, interest rates, and global market instability. Gold is now trading above $3,000 per ounce, marking a historic milestone. With ongoing geopolitical tensions and recession fears, analysts predict further price appreciation in the coming months.
Gold’s Historic Rally: Inflation & Market Uncertainty Drive Prices Up
Multiple economic factors drive gold’s recent surge. Investors are pulling funds from equities and cryptocurrencies, opting for the stability of Gold. The metal hit a new all-time high before stabilizing near a slightly lower level. The next key resistance level is $3,100, a psychological barrier that could determine the next phase of the rally.
The anticipated report on US household expenditures and inflation trends will be crucial. The monthly core inflation measure is expected to remain unchanged at 0.3%, indicating steady price pressures. If inflation stays high, the Federal Reserve may delay interest rate cuts, which could further support Gold’s bullish momentum.
Additionally, the effects of the recent tariff policies in the US remain uncertain. Investors fear that inflation could spike due to trade restrictions, pushing more capital into safe-haven assets like Gold. The risk of stagflation or recession looms large, adding to market volatility and strengthening the case for Gold as a store of value.
Gold’s Technical Breakout from Long-Term Rising Wedge
The technical chart shows Gold breaking out of a long-term rising wedge pattern. Historically, such breakouts indicate strong bullish momentum. The price has decisively moved above the upper trendline, confirming the breakout.
Strong volume broke the long-term resistance near $2,600, and Gold has now surged past $3,000. Based on historical Fibonacci extensions, the next major resistance lies near $3,500. A sustained move above $3,100 could signal further upside, while any pullback may find support around $2,800.
(Click on image to enlarge)
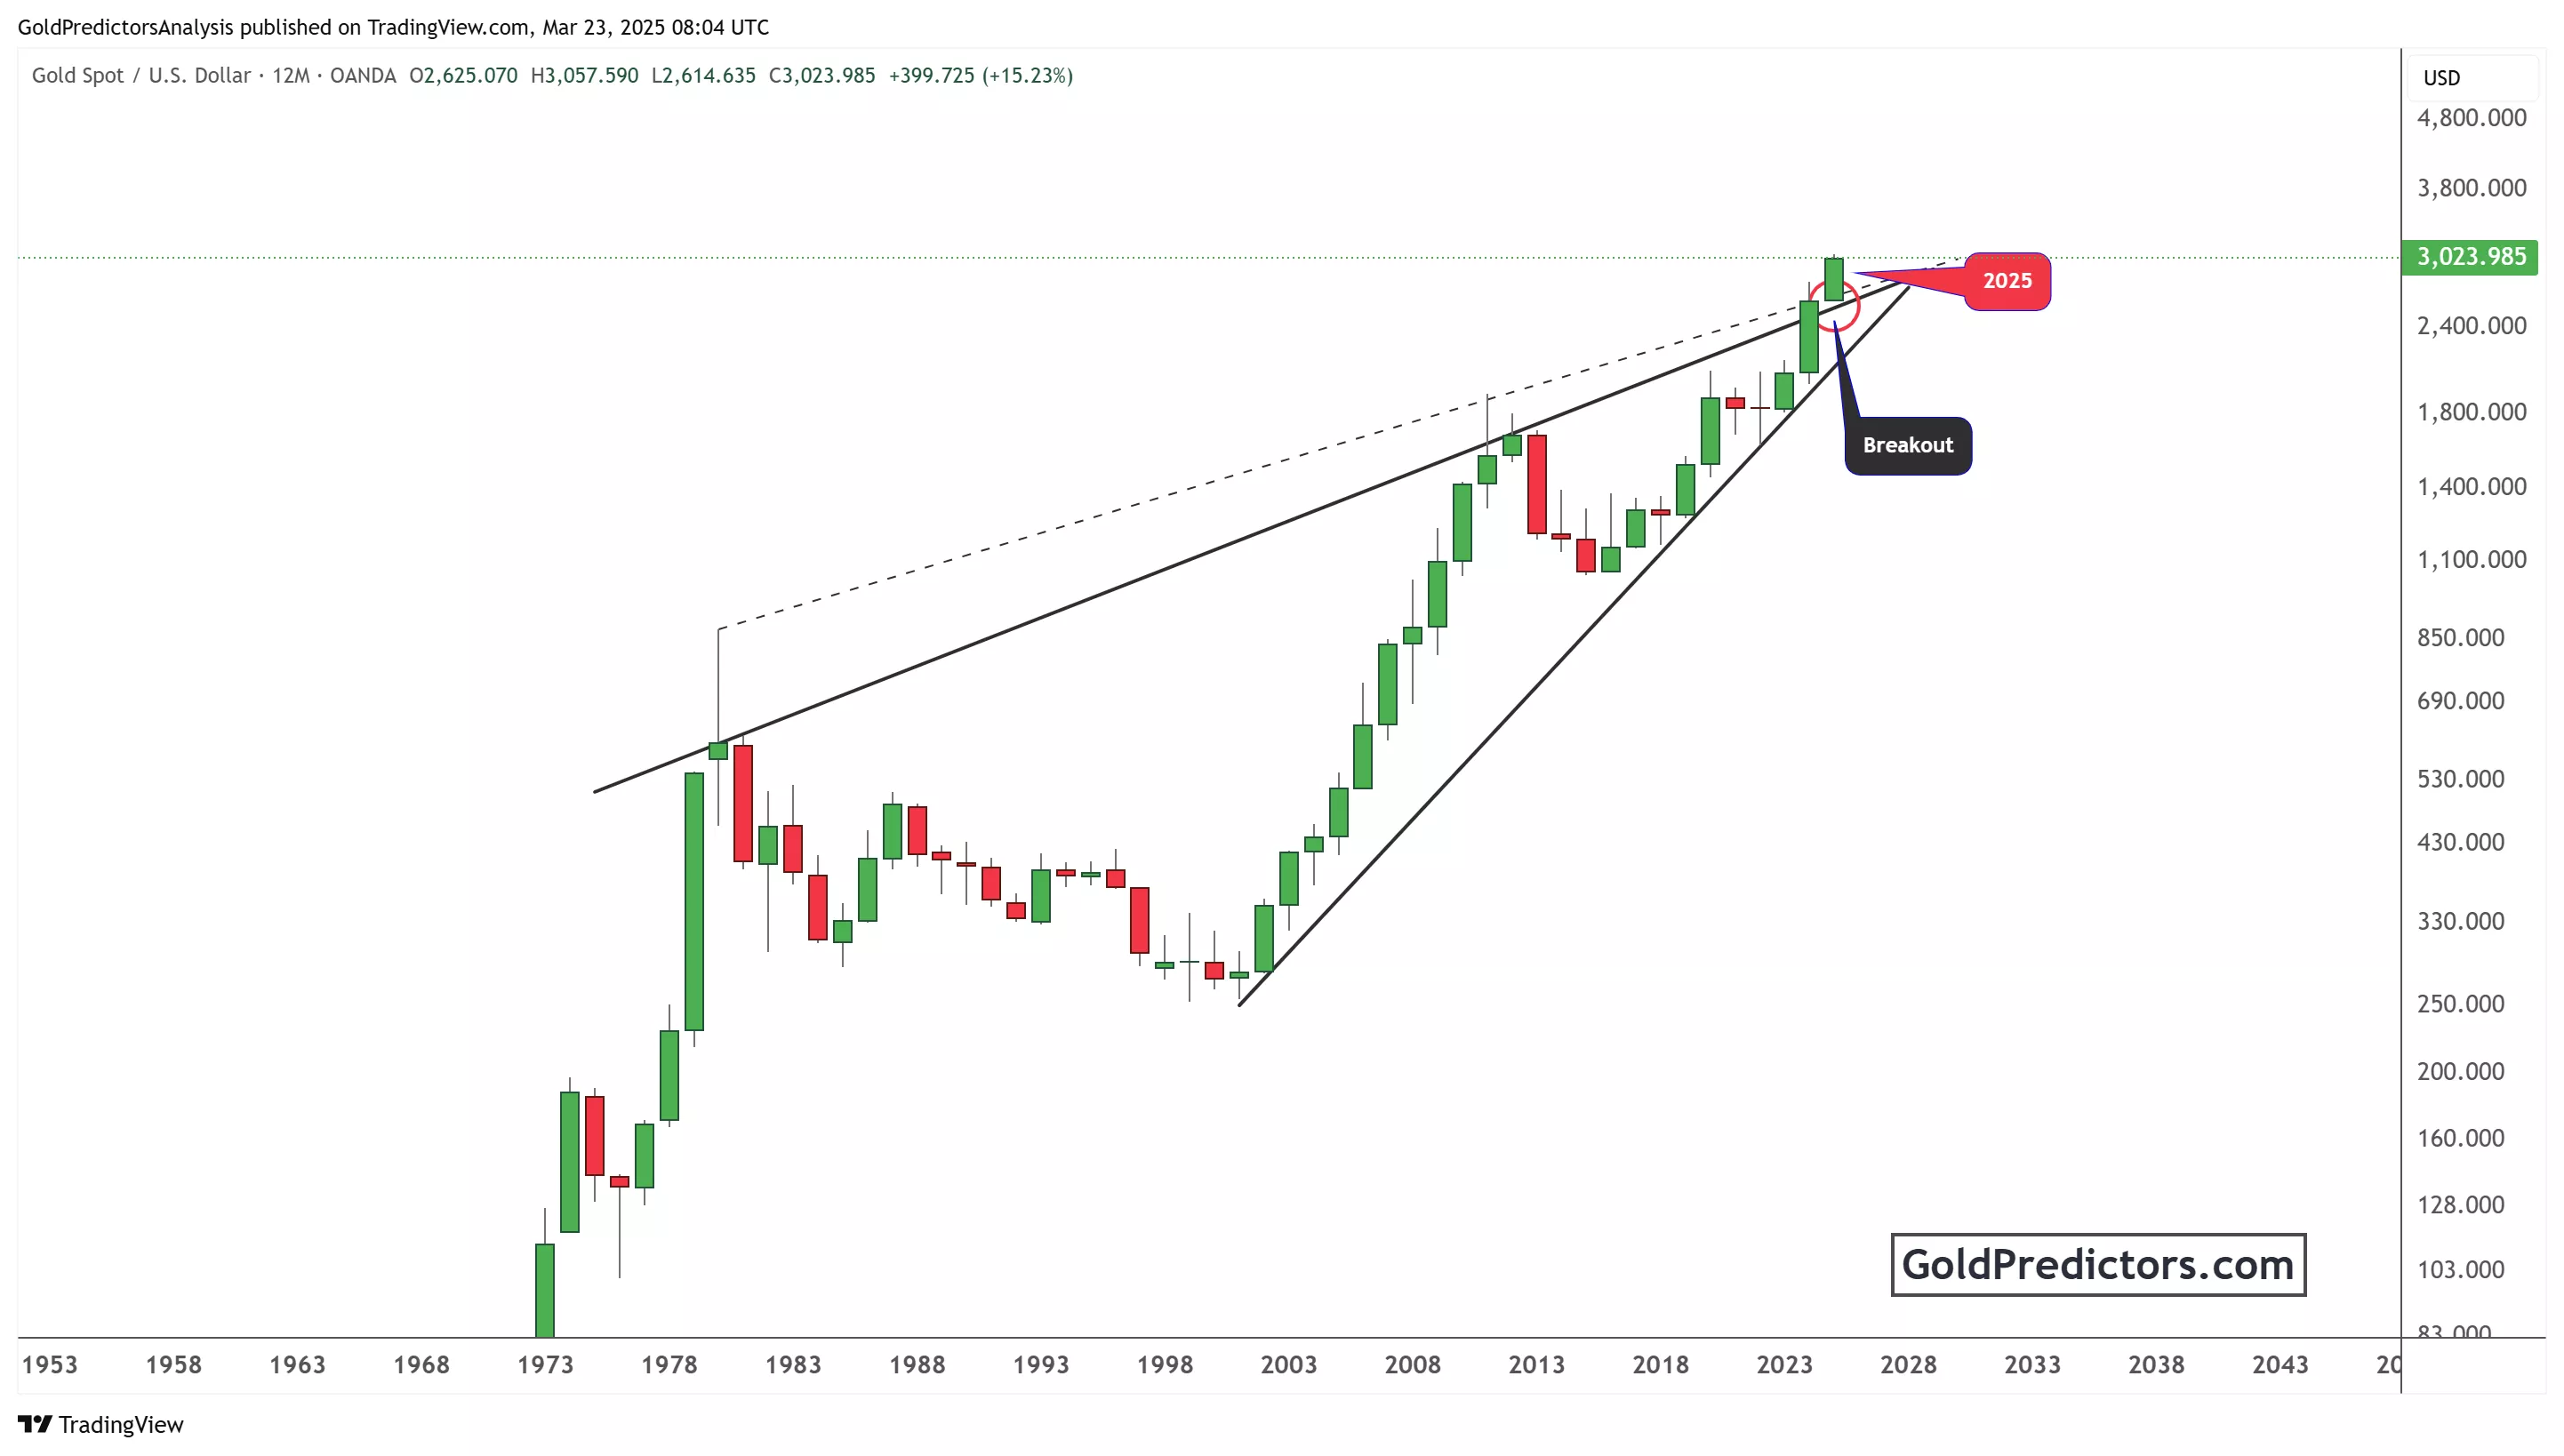
The formation of higher highs and higher lows suggests a continued bullish trend. If the price sustains above the breakout zone, further gains are likely. However, traders should remain cautious, as overbought conditions could trigger short-term corrections.
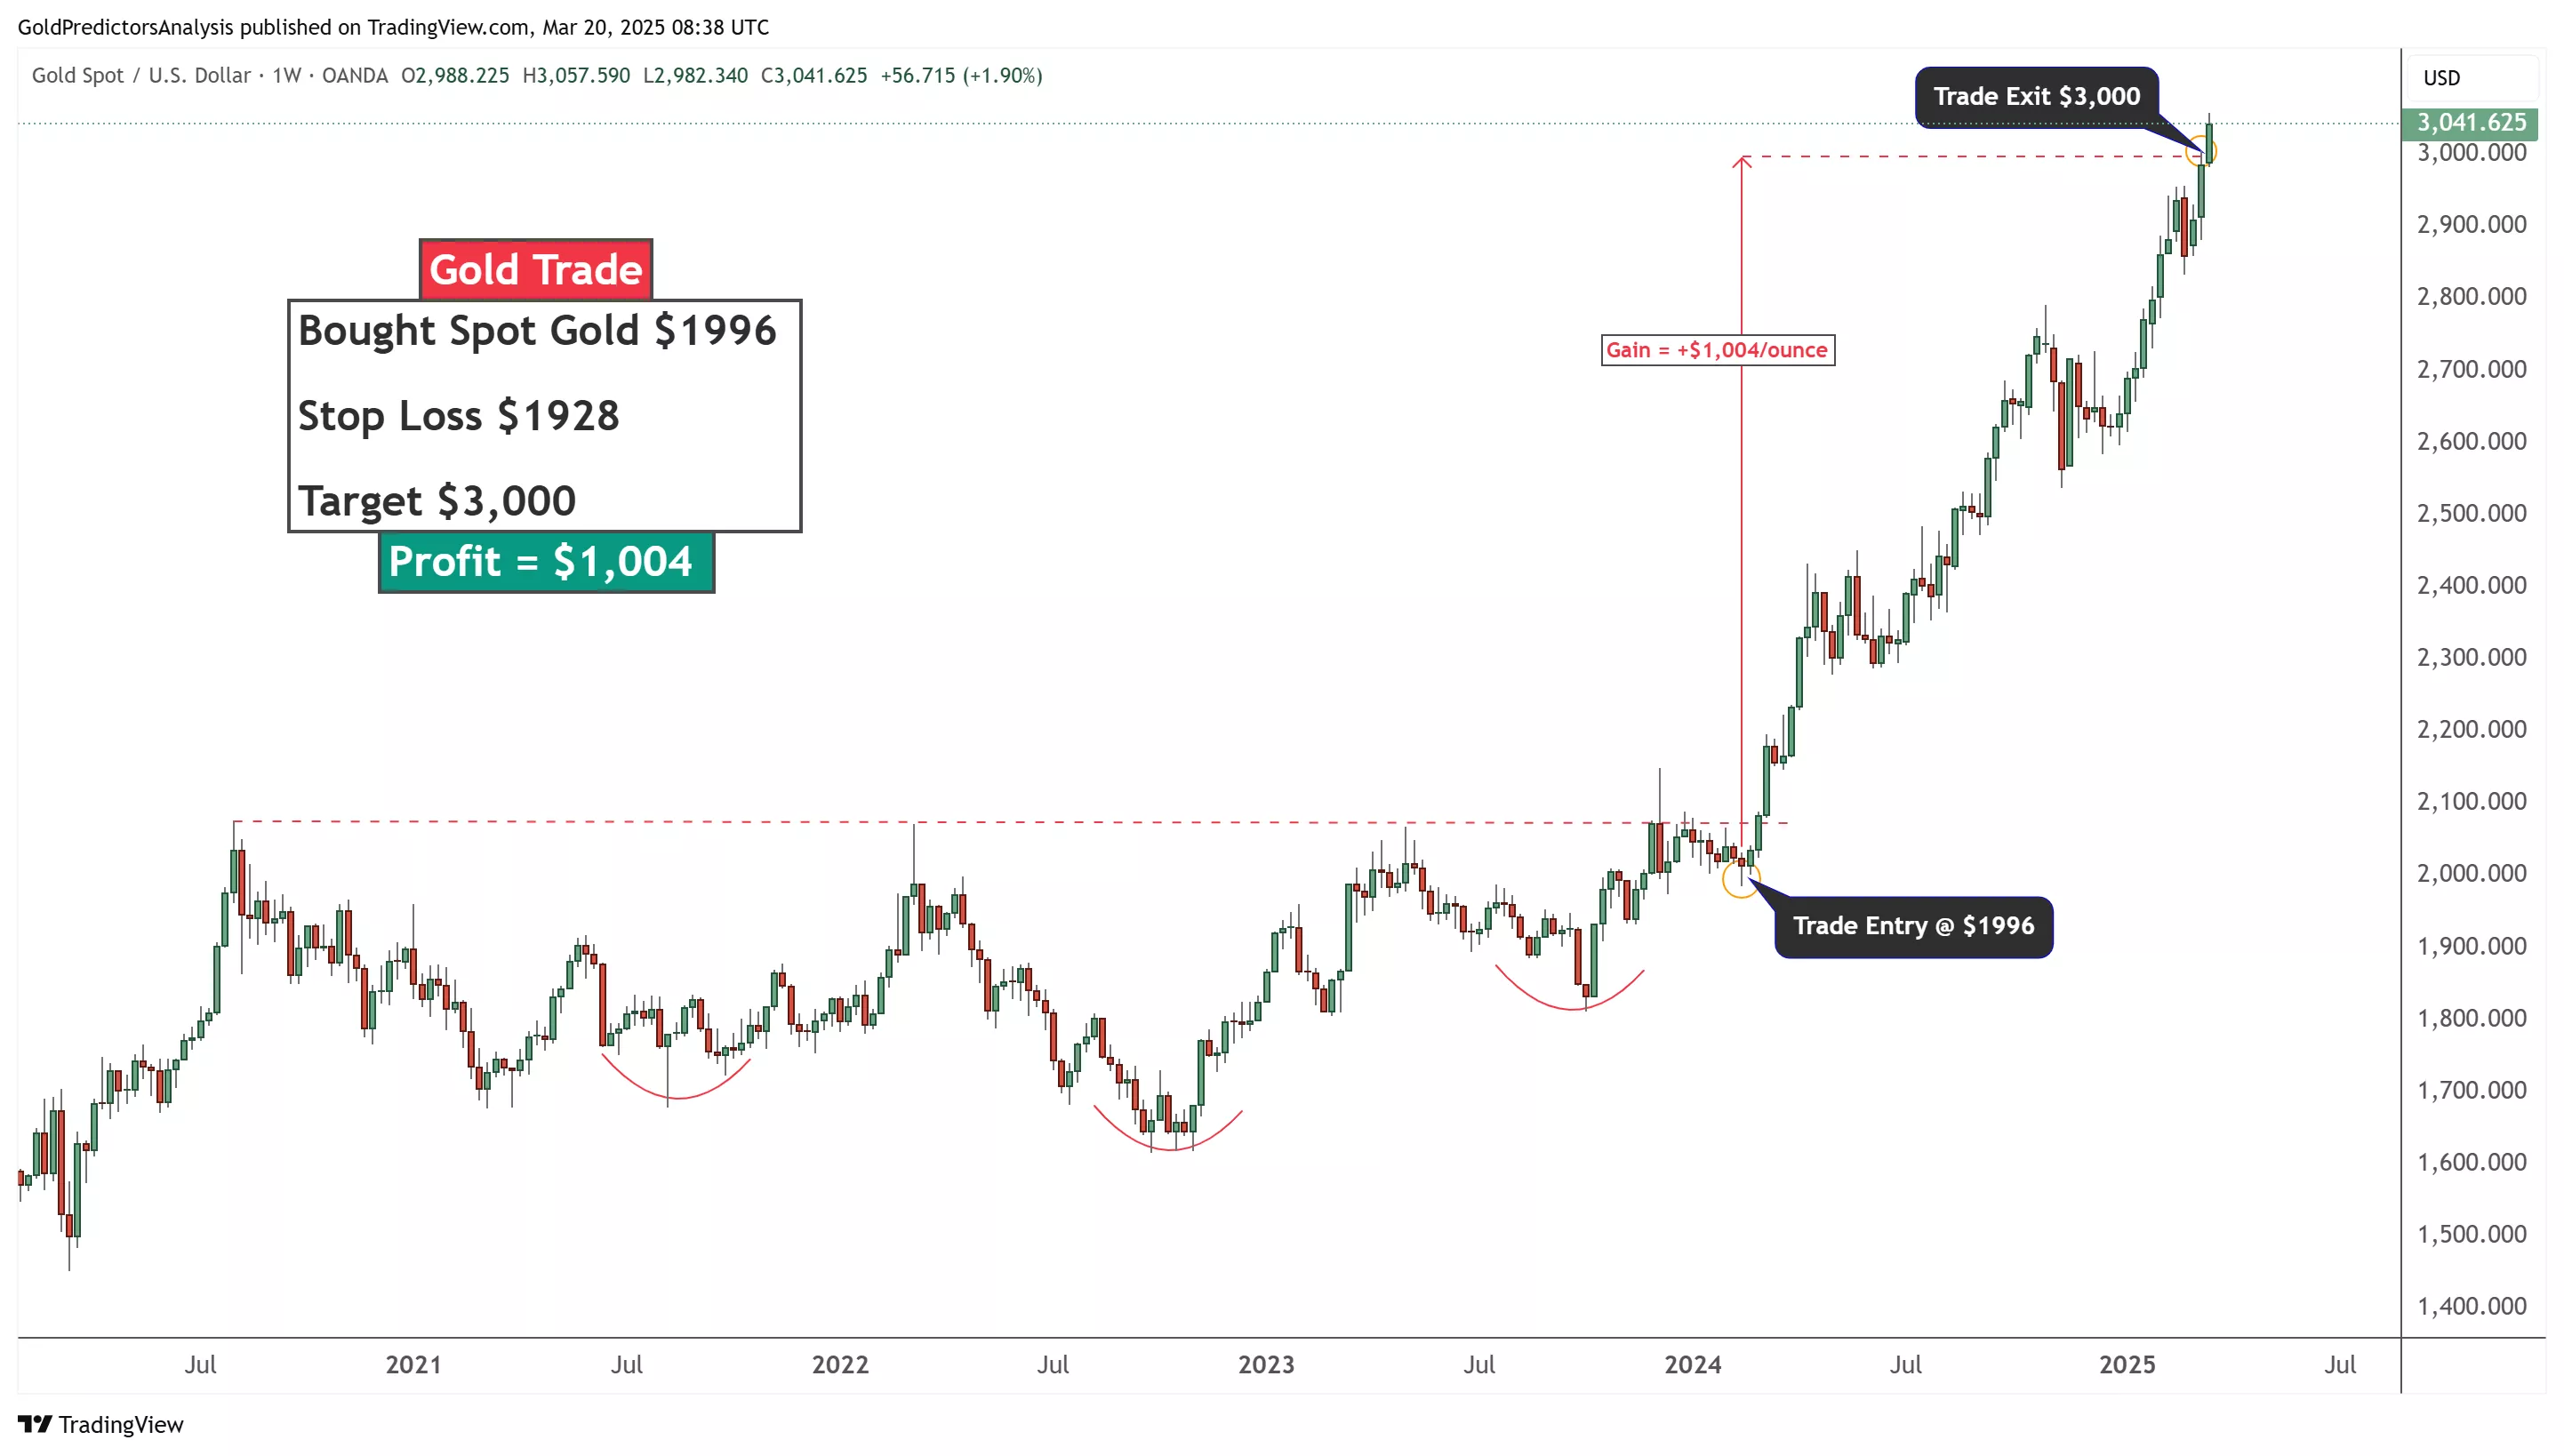
How to Trade Gold During Economic Uncertainty?
The chart below shows a successful gold trade strategy by Gold Predictors. Spot gold was bought at $1,996, with a stop loss set at $1,928. The target price was $3,000, and the trade exited at that level. The price movement followed a cup-and-handle pattern before breaking out. This trade was shared via WhatsApp before execution. The trader secured a profit of $1,004 per ounce. The chart highlights the importance of setting clear entry, exit, and stop-loss levels.
(Click on image to enlarge)
Conclusion
Gold’s breakout above $3,000 is a significant milestone, driven by economic uncertainty and inflation fears. Investors are seeking safety amid market volatility, pushing Gold prices higher. Technical analysis confirms a strong bullish trend, with key resistance levels ahead. If macroeconomic conditions continue to favor safe-haven assets, Gold could extend its rally further. The next few weeks will be critical in determining whether the metal can sustain its gains and push toward new highs.
More By This Author:
Gold’s Bullish Trend Continues: Can It Hit A New All-Time High?
Gold’s Historic Surge: Market Analysis And Investment Opportunities
Gold Market Shows Strong Momentum With Signs Of Retracement
To receive gold and silver trading signals and premium updates, please subscribe here.
Disclosure: Materials distributed by ...
more

