

Image Source: Pixabay
Gold prices (XAU/USD) recently touched an all-time high before facing a pullback. The price surge was driven by market uncertainty and the Federal Reserve's expectations of future rate cuts. However, technical indicators suggest a possible short-term retracement as investors lock in profits. Meanwhile, broader geopolitical and economic factors continue to shape the gold market.
Gold Price Movement and Market Dynamics
Gold prices have seen a remarkable uptrend, fueled by safe-haven demand and monetary policy expectations. However, after three consecutive days of gains, the metal has retraced slightly. This decline is attributed to profit-taking and a mild US Dollar (USD) recovery.
One of the primary drivers of gold’s recent rally has been the growing consensus that the Federal Reserve will resume its rate-cutting cycle soon. Additionally, geopolitical concerns, particularly in the Middle East and tensions related to global trade, have supported safe-haven demand.
Equity markets have responded positively to the Federal Reserve’s decision to maintain its forecast for rate cuts, lifting overall risk sentiment. The temporary de-escalation in the Ukraine conflict following discussions between the US, Russia, and Ukraine has eased investor concerns. These factors collectively contribute to the short-term softness in gold prices.
Technical Analysis of Gold Price Chart
The gold price chart shows a well-defined ascending channel, which has guided price action for months. The latest price movement indicates that gold is approaching the upper boundary of this channel, a key resistance level.
Gold has tested this resistance multiple times, often leading to price pullbacks. The latest test, around $3,100, suggests that sellers might step in again. A double bottom formation earlier in the trend near the channel's lower boundary was a strong support level, contributing to the recent bullish momentum. This structure highlights the importance of these key levels in determining future price action.
(Click on image to enlarge)
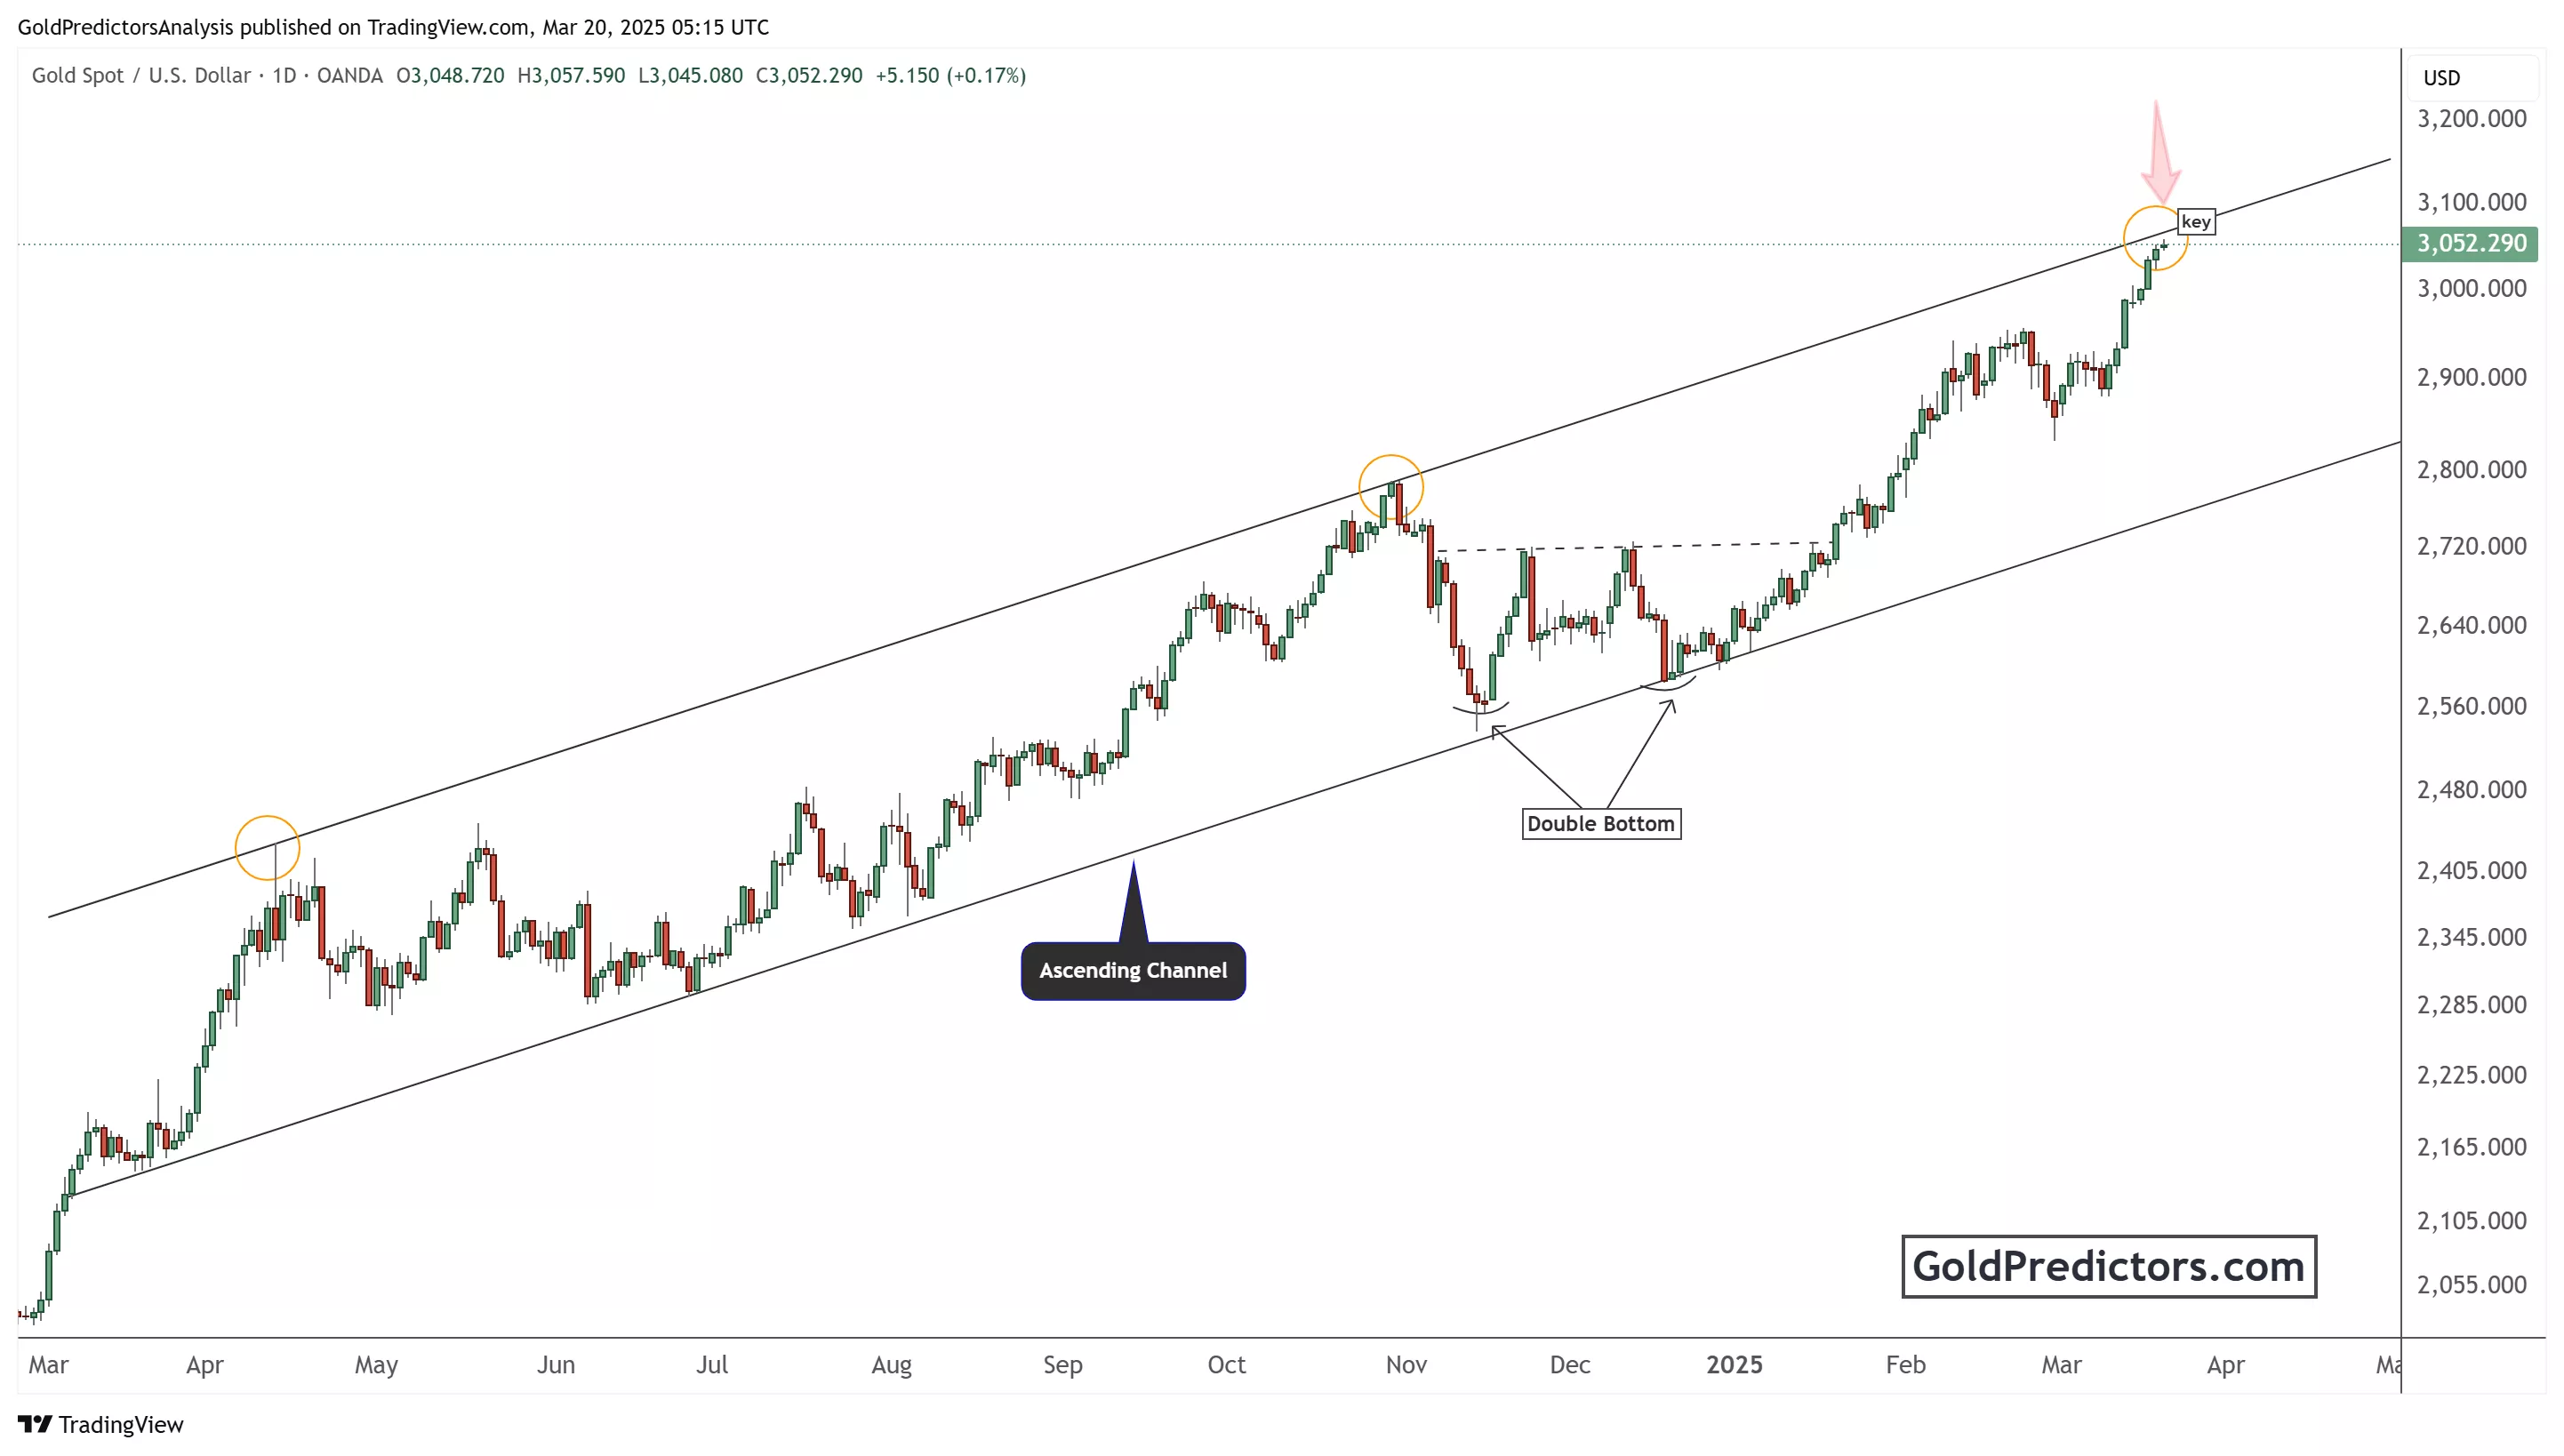
Additionally, profit-taking signals are emerging as the market appears slightly overbought. Previous instances where gold reached the upper trend line led to temporary retracements, suggesting caution for traders. The current price action represents a key decision point, where a breakout above the channel could lead to further upside. At the same time, a rejection might trigger a short-term correction toward the mid or lower boundary of the channel.
Traders should closely monitor whether gold exceeds the $3,050-$3,100 range. A confirmed breakout could fuel continued bullish momentum. On the other hand, failure to hold above resistance might invite a pullback toward more assertive support zones, leading to a potential correction in the price movement.
Conclusion
Gold’s price is at a critical point. Strong bullish momentum is testing resistance levels. Expected Fed rate cuts and geopolitical uncertainties support long-term gains. However, the technical setup signals a possible retracement. Traders should confirm a breakout or rejection at key levels before acting. The trend is bullish, but short-term fluctuations bring both risks and opportunities.To receive gold and silver trading signals, please subscribe here.
More By This Author:
Gold Prices Hit Record High Above $3,000 As Economic Uncertainty Grows
Gold Holds Near Record Levels As Safe-Haven Demand Rises
Gold Prices Surge To New Highs Amid Trade Tensions And Fed Rate Cuts


Comments
Log in or sign up to join the conversation.