
Natural Gas: When A Trade Plan Provides Consecutive Wins
From time to time, we may want to consider volatility as an ally. After all, why would highly volatile markets necessarily mean more losing trades?
The first target was hit – BOOM! Today – just before the weekend – it is time to bank some profits from my recent trade projections (provided on March 2). Since then, the trade plan has provided our dear subscribers with multiple bounces to trade the NYMEX Natural Gas Futures (April contract) in various ways, always depending on each one’s personal risk profile.
The first possibility is the swing trading with the trailing stop method explained in my famous risk management article.
Trade entry triggered on Tuesday, March 8 (firm rebound on yellow band), stop lifted once price extends beyond mid-point (median) price between first target and entry, thus ending at $4.607 (black dotted line), given the market closed at its daily high of $4.704 (purple dotted line) that same day and assuming you entered that long trade at $4.550 (top of the yellow band). That was a quick one that lasted only a couple of hours for the day traders who closed their trades at the regular market close (two candles later, see below chart). For the swing traders, the win-stop was triggered the next day (Wednesday) on the following pull-back.
(Click on image to enlarge)
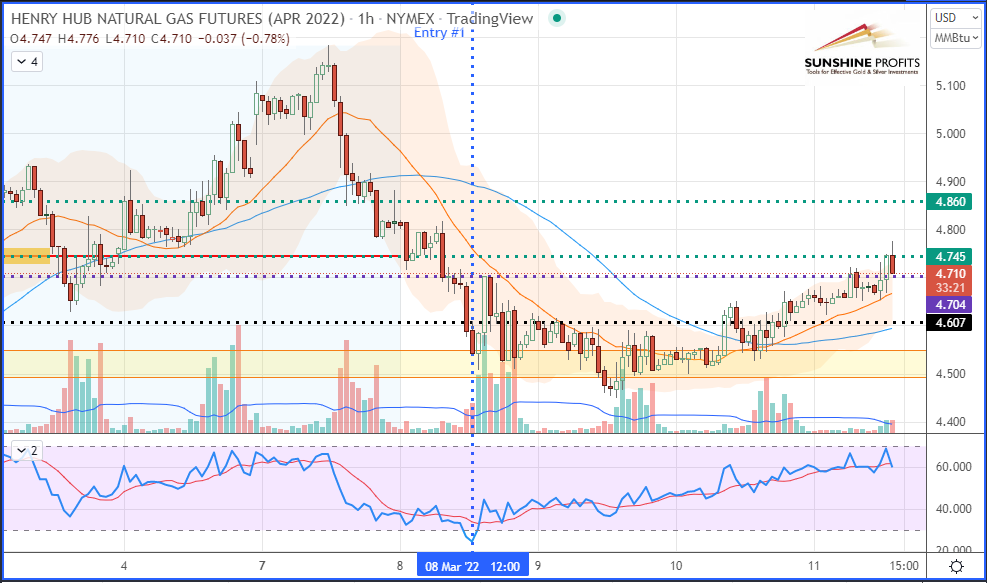
Henry Hub Natural Gas (NGJ22) Futures (April contract, hourly chart)
The second option is to scale the rebounds with fixed targets (active or experienced traders). This method consists of “riding the tails” (or the shadows). To get a better grasp of this concept, let’s zoom out on a 4H-chart so you can see the multiple rebounds of the price characterized by the shadows (or tails) of candlesticks, where a crowd of bulls is placing buy orders around that yellow support zone, therefore squeezing bears by pushing prices towards the upside (like some sort of rope pulling game). This trading style often requires stops to be tighter with some profit-to-risk ratio greater than 1.5 (with usually fixed targets).
(Click on image to enlarge)
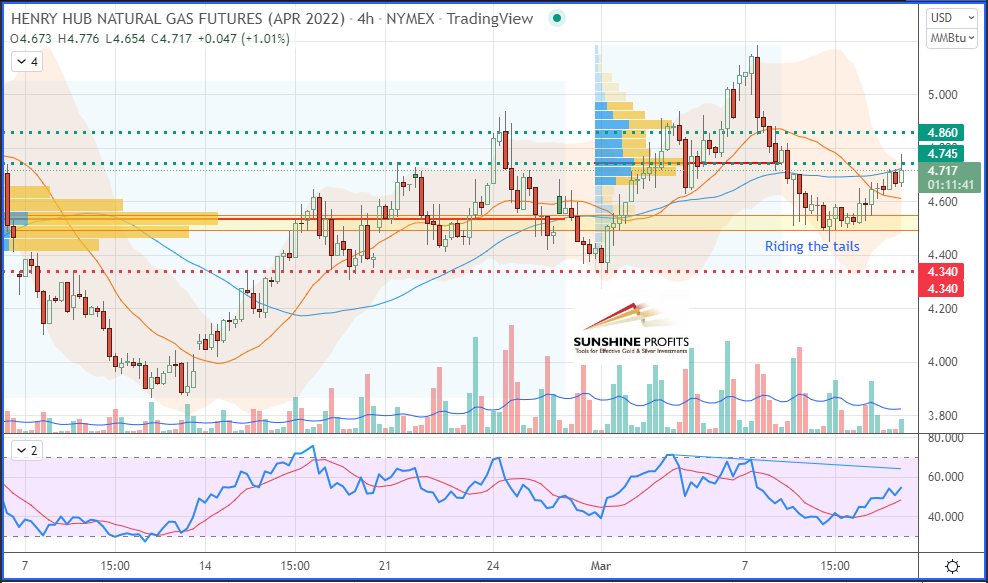
Henry Hub Natural Gas (NGJ22) Futures (April contract, 4H chart)

Third possibility: position trading. This is probably the most passive trading style, as it would suit everyone’s busy timetable (and be the most rewarding). This is usually the one we privilege at Sunshine Profits since it allows us to provide trade projections some time in advance for our patient sniper traders to lock in their trading targets and take sufficient time to assess the associated risk with each projection as part of a full trade plan (or flying map).

Let’s zoom out again to spot our first target getting hit today on a daily chart so we can have an overall view of the next target to be locked in while lifting our stop to breakeven (entry), previous swing low ($4.450), or using an Average True Range (ATR) ratio as some of you may like to use:
(Click on image to enlarge)
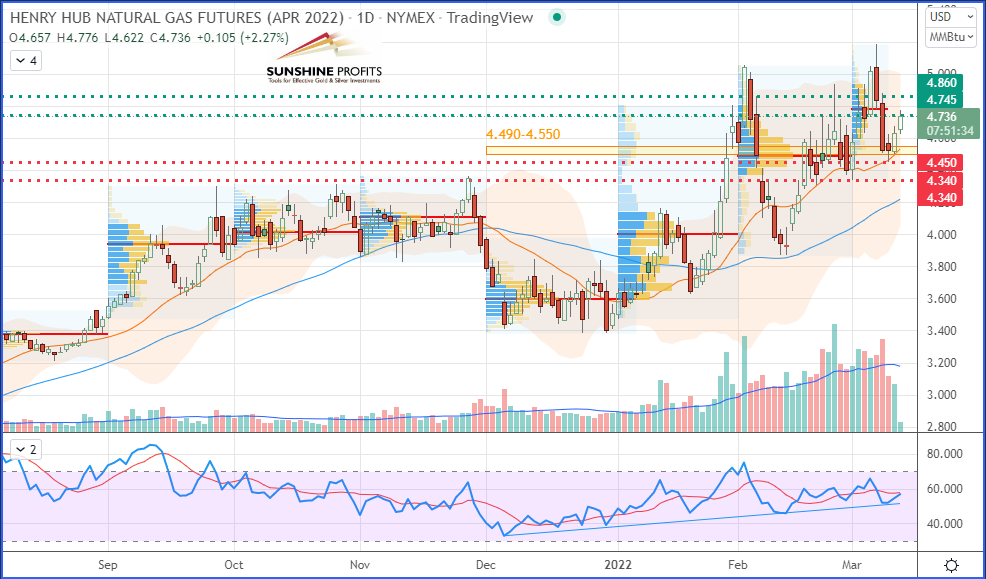
Henry Hub Natural Gas (NGJ22) Futures (April contract, daily chart)
That’s all folks for today. Have a great weekend!
Disclaimer: All essays, research and information found in this article represent the analyses and opinions of Sunshine Profits' associates only. As such, it may prove wrong and be ...
more

